Immigrants from Hong Kong vs Polish Cognitive Disability
COMPARE
Immigrants from Hong Kong
Polish
Cognitive Disability
Cognitive Disability Comparison
Immigrants from Hong Kong
Poles
16.0%
COGNITIVE DISABILITY
100.0/ 100
METRIC RATING
5th/ 347
METRIC RANK
16.4%
COGNITIVE DISABILITY
99.9/ 100
METRIC RATING
28th/ 347
METRIC RANK
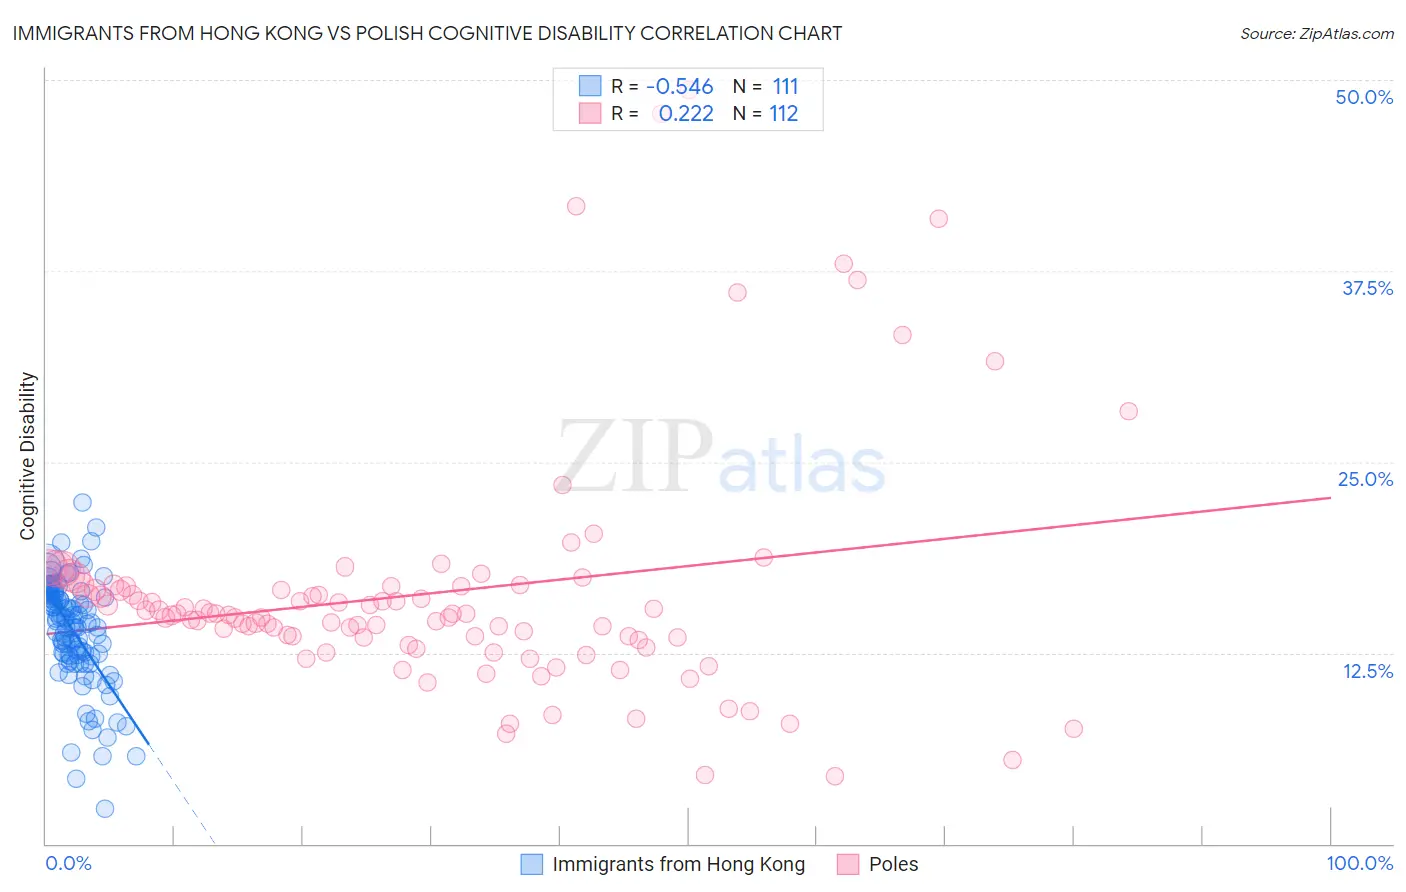
Immigrants from Hong Kong vs Polish Cognitive Disability Correlation Chart
The statistical analysis conducted on geographies consisting of 253,985,578 people shows a substantial negative correlation between the proportion of Immigrants from Hong Kong and percentage of population with cognitive disability in the United States with a correlation coefficient (R) of -0.546 and weighted average of 16.0%. Similarly, the statistical analysis conducted on geographies consisting of 560,438,383 people shows a weak positive correlation between the proportion of Poles and percentage of population with cognitive disability in the United States with a correlation coefficient (R) of 0.222 and weighted average of 16.4%, a difference of 2.3%.
Cognitive Disability Correlation Summary
| Measurement | Immigrants from Hong Kong | Polish |
| Minimum | 2.3% | 4.4% |
| Maximum | 22.3% | 49.3% |
| Range | 20.0% | 44.9% |
| Mean | 13.8% | 16.4% |
| Median | 14.4% | 15.0% |
| Interquartile 25% (IQ1) | 12.2% | 13.4% |
| Interquartile 75% (IQ3) | 16.1% | 16.8% |
| Interquartile Range (IQR) | 3.9% | 3.4% |
| Standard Deviation (Sample) | 3.5% | 7.8% |
| Standard Deviation (Population) | 3.5% | 7.8% |
Similar Demographics by Cognitive Disability
Demographics Similar to Immigrants from Hong Kong by Cognitive Disability
In terms of cognitive disability, the demographic groups most similar to Immigrants from Hong Kong are Immigrants from Lithuania (16.0%, a difference of 0.41%), Chinese (15.9%, a difference of 0.59%), Thai (16.1%, a difference of 0.61%), Immigrants from India (15.9%, a difference of 0.68%), and Immigrants from Ireland (16.1%, a difference of 0.72%).
| Demographics | Rating | Rank | Cognitive Disability |
| Immigrants | Taiwan | 100.0 /100 | #1 | Exceptional 15.7% |
| Immigrants | India | 100.0 /100 | #2 | Exceptional 15.9% |
| Chinese | 100.0 /100 | #3 | Exceptional 15.9% |
| Immigrants | Lithuania | 100.0 /100 | #4 | Exceptional 16.0% |
| Immigrants | Hong Kong | 100.0 /100 | #5 | Exceptional 16.0% |
| Thais | 100.0 /100 | #6 | Exceptional 16.1% |
| Immigrants | Ireland | 100.0 /100 | #7 | Exceptional 16.1% |
| Immigrants | Poland | 100.0 /100 | #8 | Exceptional 16.1% |
| Assyrians/Chaldeans/Syriacs | 100.0 /100 | #9 | Exceptional 16.2% |
| Immigrants | Scotland | 100.0 /100 | #10 | Exceptional 16.2% |
| Immigrants | Czechoslovakia | 100.0 /100 | #11 | Exceptional 16.2% |
| Maltese | 100.0 /100 | #12 | Exceptional 16.2% |
| Lithuanians | 100.0 /100 | #13 | Exceptional 16.3% |
| Immigrants | Austria | 100.0 /100 | #14 | Exceptional 16.3% |
| Immigrants | Greece | 100.0 /100 | #15 | Exceptional 16.3% |
Demographics Similar to Poles by Cognitive Disability
In terms of cognitive disability, the demographic groups most similar to Poles are Immigrants from Pakistan (16.4%, a difference of 0.0%), Immigrants from Croatia (16.4%, a difference of 0.020%), Filipino (16.4%, a difference of 0.030%), Czech (16.4%, a difference of 0.030%), and Luxembourger (16.4%, a difference of 0.050%).
| Demographics | Rating | Rank | Cognitive Disability |
| Immigrants | Cuba | 100.0 /100 | #21 | Exceptional 16.3% |
| Immigrants | South Central Asia | 99.9 /100 | #22 | Exceptional 16.4% |
| Croatians | 99.9 /100 | #23 | Exceptional 16.4% |
| Immigrants | Argentina | 99.9 /100 | #24 | Exceptional 16.4% |
| Luxembourgers | 99.9 /100 | #25 | Exceptional 16.4% |
| Immigrants | Croatia | 99.9 /100 | #26 | Exceptional 16.4% |
| Immigrants | Pakistan | 99.9 /100 | #27 | Exceptional 16.4% |
| Poles | 99.9 /100 | #28 | Exceptional 16.4% |
| Filipinos | 99.9 /100 | #29 | Exceptional 16.4% |
| Czechs | 99.9 /100 | #30 | Exceptional 16.4% |
| Immigrants | Romania | 99.9 /100 | #31 | Exceptional 16.4% |
| Immigrants | Israel | 99.9 /100 | #32 | Exceptional 16.4% |
| Italians | 99.9 /100 | #33 | Exceptional 16.4% |
| Russians | 99.9 /100 | #34 | Exceptional 16.4% |
| Slovaks | 99.9 /100 | #35 | Exceptional 16.4% |