Immigrants from Hong Kong vs Immigrants from Guatemala Seniors Poverty Over the Age of 65
COMPARE
Immigrants from Hong Kong
Immigrants from Guatemala
Seniors Poverty Over the Age of 65
Seniors Poverty Over the Age of 65 Comparison
Immigrants from Hong Kong
Immigrants from Guatemala
11.1%
SENIORS POVERTY OVER THE AGE OF 65
36.3/ 100
METRIC RATING
188th/ 347
METRIC RANK
13.8%
SENIORS POVERTY OVER THE AGE OF 65
0.0/ 100
METRIC RATING
293rd/ 347
METRIC RANK
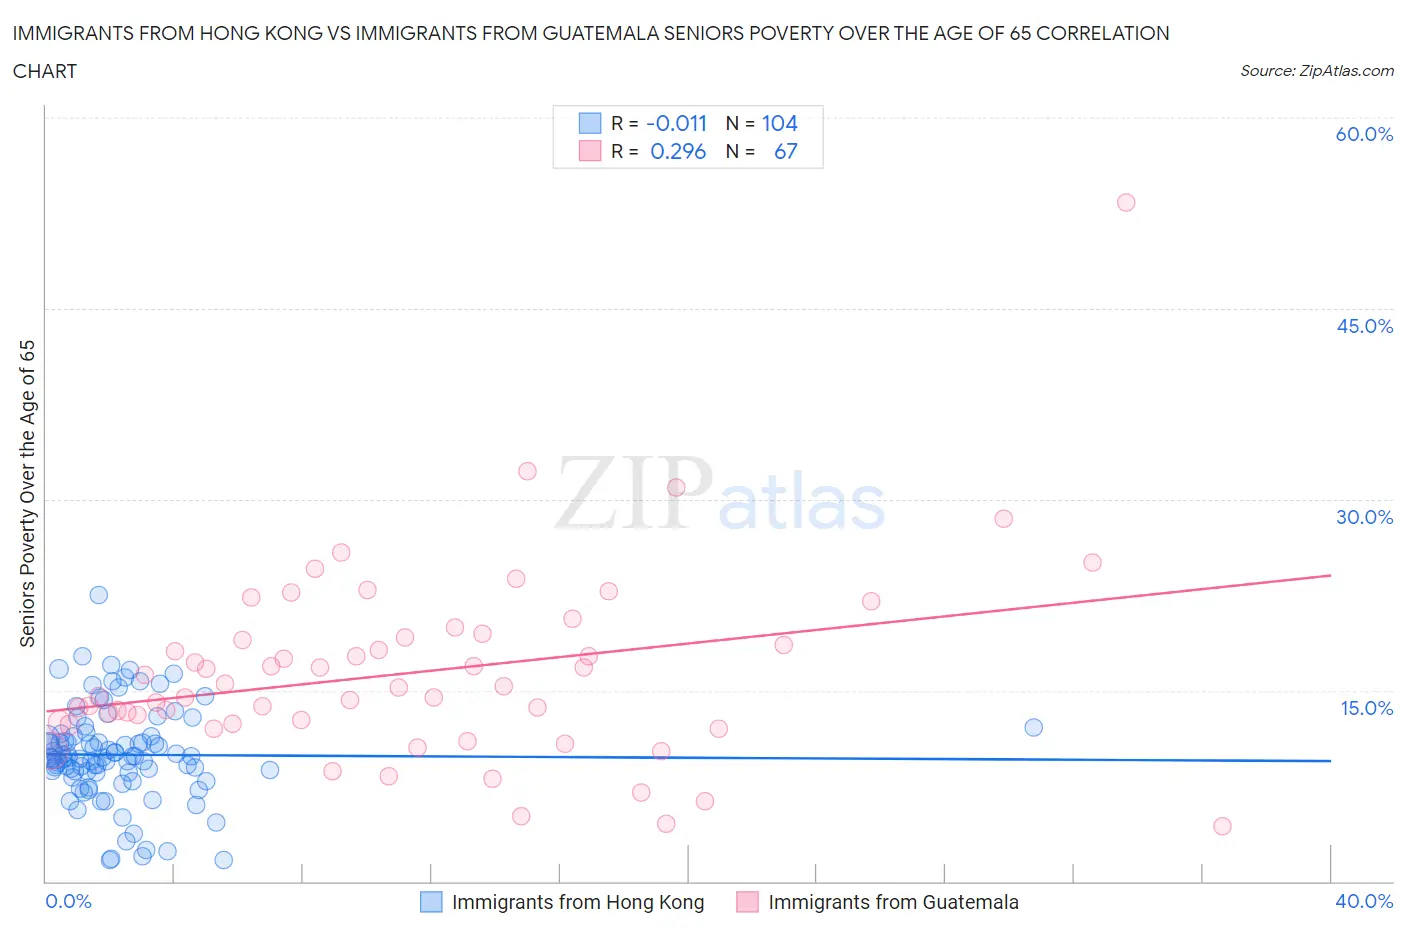
Immigrants from Hong Kong vs Immigrants from Guatemala Seniors Poverty Over the Age of 65 Correlation Chart
The statistical analysis conducted on geographies consisting of 253,445,641 people shows no correlation between the proportion of Immigrants from Hong Kong and poverty level among seniors over the age of 65 in the United States with a correlation coefficient (R) of -0.011 and weighted average of 11.1%. Similarly, the statistical analysis conducted on geographies consisting of 376,570,340 people shows a weak positive correlation between the proportion of Immigrants from Guatemala and poverty level among seniors over the age of 65 in the United States with a correlation coefficient (R) of 0.296 and weighted average of 13.8%, a difference of 24.9%.
Seniors Poverty Over the Age of 65 Correlation Summary
| Measurement | Immigrants from Hong Kong | Immigrants from Guatemala |
| Minimum | 1.6% | 4.3% |
| Maximum | 22.5% | 53.3% |
| Range | 20.9% | 49.0% |
| Mean | 9.9% | 16.4% |
| Median | 9.7% | 15.2% |
| Interquartile 25% (IQ1) | 8.5% | 12.4% |
| Interquartile 75% (IQ3) | 11.4% | 19.1% |
| Interquartile Range (IQR) | 2.9% | 6.7% |
| Standard Deviation (Sample) | 3.7% | 7.5% |
| Standard Deviation (Population) | 3.7% | 7.4% |
Similar Demographics by Seniors Poverty Over the Age of 65
Demographics Similar to Immigrants from Hong Kong by Seniors Poverty Over the Age of 65
In terms of seniors poverty over the age of 65, the demographic groups most similar to Immigrants from Hong Kong are Immigrants from Laos (11.1%, a difference of 0.060%), Immigrants from Middle Africa (11.1%, a difference of 0.10%), Immigrants from Eastern Asia (11.1%, a difference of 0.11%), Immigrants from Lebanon (11.1%, a difference of 0.17%), and Indian (Asian) (11.1%, a difference of 0.21%).
| Demographics | Rating | Rank | Seniors Poverty Over the Age of 65 |
| Immigrants | Eastern Africa | 43.4 /100 | #181 | Average 11.0% |
| Immigrants | Fiji | 42.0 /100 | #182 | Average 11.0% |
| Immigrants | Kazakhstan | 41.0 /100 | #183 | Average 11.0% |
| Immigrants | France | 40.9 /100 | #184 | Average 11.0% |
| Immigrants | Lebanon | 38.2 /100 | #185 | Fair 11.1% |
| Immigrants | Eastern Asia | 37.5 /100 | #186 | Fair 11.1% |
| Immigrants | Middle Africa | 37.4 /100 | #187 | Fair 11.1% |
| Immigrants | Hong Kong | 36.3 /100 | #188 | Fair 11.1% |
| Immigrants | Laos | 35.7 /100 | #189 | Fair 11.1% |
| Indians (Asian) | 34.2 /100 | #190 | Fair 11.1% |
| Immigrants | Uganda | 32.2 /100 | #191 | Fair 11.1% |
| Immigrants | Southern Europe | 30.1 /100 | #192 | Fair 11.1% |
| Taiwanese | 29.2 /100 | #193 | Fair 11.2% |
| Chileans | 27.8 /100 | #194 | Fair 11.2% |
| Immigrants | Vietnam | 26.6 /100 | #195 | Fair 11.2% |
Demographics Similar to Immigrants from Guatemala by Seniors Poverty Over the Age of 65
In terms of seniors poverty over the age of 65, the demographic groups most similar to Immigrants from Guatemala are Spanish American Indian (13.8%, a difference of 0.19%), Cheyenne (13.9%, a difference of 0.42%), Apache (13.9%, a difference of 0.61%), Black/African American (13.7%, a difference of 0.88%), and Immigrants from Jamaica (13.9%, a difference of 0.88%).
| Demographics | Rating | Rank | Seniors Poverty Over the Age of 65 |
| Immigrants | Senegal | 0.0 /100 | #286 | Tragic 13.6% |
| Immigrants | Mexico | 0.0 /100 | #287 | Tragic 13.6% |
| Belizeans | 0.0 /100 | #288 | Tragic 13.6% |
| Jamaicans | 0.0 /100 | #289 | Tragic 13.6% |
| Immigrants | Central America | 0.0 /100 | #290 | Tragic 13.6% |
| Blacks/African Americans | 0.0 /100 | #291 | Tragic 13.7% |
| Spanish American Indians | 0.0 /100 | #292 | Tragic 13.8% |
| Immigrants | Guatemala | 0.0 /100 | #293 | Tragic 13.8% |
| Cheyenne | 0.0 /100 | #294 | Tragic 13.9% |
| Apache | 0.0 /100 | #295 | Tragic 13.9% |
| Immigrants | Jamaica | 0.0 /100 | #296 | Tragic 13.9% |
| Vietnamese | 0.0 /100 | #297 | Tragic 14.0% |
| Immigrants | Belize | 0.0 /100 | #298 | Tragic 14.0% |
| Ecuadorians | 0.0 /100 | #299 | Tragic 14.0% |
| Immigrants | Uzbekistan | 0.0 /100 | #300 | Tragic 14.0% |