Immigrants from Honduras vs Okinawan Unemployment Among Ages 25 to 29 years

COMPARE

Immigrants from Honduras
Race
Ancestry
AfghanAfricanAlaska NativeAlaskan AthabascanAlbanianAleutAlsatianAmericanApacheArabArapahoArgentineanArmenianAssyrian/Chaldean/SyriacAustralianAustrianBahamianBangladeshiBarbadianBasqueBelgianBelizeanBermudanBhutaneseBlackfeetBolivianBrazilianBritishBritish West IndianBulgarianBurmeseCajunCambodianCanadianCape VerdeanCarpatho RusynCelticCentral AmericanCentral American IndianCherokeeCheyenneChickasawChileanChineseChippewaChoctawColombianColvilleComancheCosta RicanCreeCreekCroatianCrowCubanCypriotCzechCzechoslovakianDanishDelawareDominicanDutchDutch West IndianEastern EuropeanEcuadorianEgyptianEnglishEstonianEthiopianEuropeanFijianFilipinoFinnishFrenchFrench American IndianFrench CanadianGermanGerman RussianGhanaianGreekGuamanian/ChamorroGuatemalanGuyaneseHaitianHmongHonduranHopiHoumaHungarianIcelanderIndian (Asian)IndonesianInupiatIranianIraqiIrishIroquoisIsraeliItalianJamaicanJapaneseJordanianKenyanKiowaKoreanLaotianLatvianLebaneseLiberianLithuanianLumbeeLuxembourgerMacedonianMalaysianMalteseMarshalleseMenomineeMexicanMexican American IndianMongolianMoroccanNative HawaiianNavajoNepaleseNew ZealanderNicaraguanNigerianNorthern EuropeanNorwegianOsageOttawaPaiutePakistaniPalestinianPanamanianParaguayanPennsylvania GermanPeruvianPimaPolishPortuguesePotawatomiPuebloPuerto RicanPuget Sound SalishRomanianRussianSalvadoranSamoanScandinavianScotch-IrishScottishSeminoleSenegaleseSerbianShoshoneSierra LeoneanSiouxSlavicSlovakSloveneSomaliSouth AfricanSouth AmericanSouth American IndianSoviet UnionSpaniardSpanishSpanish AmericanSpanish American IndianSri LankanSubsaharan AfricanSudaneseSwedishSwissSyrianTaiwaneseThaiTlingit-HaidaTohono O'OdhamTonganTrinidadian and TobagonianTsimshianTurkishU.S. Virgin IslanderUgandanUkrainianUruguayanUteVenezuelanVietnameseWelshWest IndianYakamaYaquiYugoslavianYumanYup'ikZimbabwean
Immigration
NonimmigrantsImmigrantsAfghanistanAfricaAlbaniaArgentinaArmeniaAsiaAustraliaAustriaBahamasBangladeshBarbadosBelarusBelgiumBelizeBoliviaBosnia and HerzegovinaBrazilBulgariaBurma/MyanmarCabo VerdeCambodiaCameroonCanadaCaribbeanCentral AmericaChileChinaColombiaCongoCosta RicaCroatiaCubaCzechoslovakiaDenmarkDominicaDominican RepublicEastern AfricaEastern AsiaEastern EuropeEcuadorEgyptEl SalvadorEnglandEritreaEthiopiaEuropeFijiFranceGermanyGhanaGreeceGrenadaGuatemalaGuyanaHaitiHondurasHong KongHungaryIndiaIndonesiaIranIraqIrelandIsraelItalyJamaicaJapanJordanKazakhstanKenyaKoreaKuwaitLaosLatin AmericaLatviaLebanonLiberiaLithuaniaMalaysiaMexicoMicronesiaMiddle AfricaMoldovaMoroccoNepalNetherlandsNicaraguaNigeriaNorth AmericaNorth MacedoniaNorthern AfricaNorthern EuropeNorwayOceaniaPakistanPanamaPeruPhilippinesPolandPortugalRomaniaRussiaSaudi ArabiaScotlandSenegalSerbiaSierra LeoneSingaporeSomaliaSouth AfricaSouth AmericaSouth Central AsiaSouth Eastern AsiaSouthern EuropeSpainSri LankaSt. Vincent and the GrenadinesSudanSwedenSwitzerlandSyriaTaiwanThailandTrinidad and TobagoTurkeyUgandaUkraineUruguayUzbekistanVenezuelaVietnamWest IndiesWestern AfricaWestern AsiaWestern EuropeYemenZaireZimbabweAzores
Okinawan
Race
Ancestry
AfghanAfricanAlaska NativeAlaskan AthabascanAlbanianAleutAlsatianAmericanApacheArabArapahoArgentineanArmenianAssyrian/Chaldean/SyriacAustralianAustrianBahamianBangladeshiBarbadianBasqueBelgianBelizeanBermudanBhutaneseBlackfeetBolivianBrazilianBritishBritish West IndianBulgarianBurmeseCajunCambodianCanadianCape VerdeanCarpatho RusynCelticCentral AmericanCentral American IndianCherokeeCheyenneChickasawChileanChineseChippewaChoctawColombianColvilleComancheCosta RicanCreeCreekCroatianCrowCubanCypriotCzechCzechoslovakianDanishDelawareDominicanDutchDutch West IndianEastern EuropeanEcuadorianEgyptianEnglishEstonianEthiopianEuropeanFijianFilipinoFinnishFrenchFrench American IndianFrench CanadianGermanGerman RussianGhanaianGreekGuamanian/ChamorroGuatemalanGuyaneseHaitianHmongHonduranHopiHoumaHungarianIcelanderIndian (Asian)IndonesianInupiatIranianIraqiIrishIroquoisIsraeliItalianJamaicanJapaneseJordanianKenyanKiowaKoreanLaotianLatvianLebaneseLiberianLithuanianLumbeeLuxembourgerMacedonianMalaysianMalteseMarshalleseMenomineeMexicanMexican American IndianMongolianMoroccanNative HawaiianNavajoNepaleseNew ZealanderNicaraguanNigerianNorthern EuropeanNorwegianOkinawanOsageOttawaPaiutePakistaniPalestinianPanamanianParaguayanPennsylvania GermanPeruvianPimaPolishPortuguesePotawatomiPuebloPuerto RicanPuget Sound SalishRomanianRussianSalvadoranSamoanScandinavianScotch-IrishScottishSeminoleSenegaleseSerbianShoshoneSierra LeoneanSiouxSlavicSlovakSloveneSomaliSouth AfricanSouth AmericanSouth American IndianSoviet UnionSpaniardSpanishSpanish AmericanSpanish American IndianSri LankanSubsaharan AfricanSudaneseSwedishSwissSyrianTaiwaneseThaiTlingit-HaidaTohono O'OdhamTonganTrinidadian and TobagonianTsimshianTurkishU.S. Virgin IslanderUgandanUkrainianUruguayanUteVenezuelanVietnameseWelshWest IndianYakamaYaquiYugoslavianYumanYup'ikZimbabwean
Immigration
NonimmigrantsImmigrantsAfghanistanAfricaAlbaniaArgentinaArmeniaAsiaAustraliaAustriaBahamasBangladeshBarbadosBelarusBelgiumBelizeBoliviaBosnia and HerzegovinaBrazilBulgariaBurma/MyanmarCabo VerdeCambodiaCameroonCanadaCaribbeanCentral AmericaChileChinaColombiaCongoCosta RicaCroatiaCubaCzechoslovakiaDenmarkDominicaDominican RepublicEastern AfricaEastern AsiaEastern EuropeEcuadorEgyptEl SalvadorEnglandEritreaEthiopiaEuropeFijiFranceGermanyGhanaGreeceGrenadaGuatemalaGuyanaHaitiHong KongHungaryIndiaIndonesiaIranIraqIrelandIsraelItalyJamaicaJapanJordanKazakhstanKenyaKoreaKuwaitLaosLatin AmericaLatviaLebanonLiberiaLithuaniaMalaysiaMexicoMicronesiaMiddle AfricaMoldovaMoroccoNepalNetherlandsNicaraguaNigeriaNorth AmericaNorth MacedoniaNorthern AfricaNorthern EuropeNorwayOceaniaPakistanPanamaPeruPhilippinesPolandPortugalRomaniaRussiaSaudi ArabiaScotlandSenegalSerbiaSierra LeoneSingaporeSomaliaSouth AfricaSouth AmericaSouth Central AsiaSouth Eastern AsiaSouthern EuropeSpainSri LankaSt. Vincent and the GrenadinesSudanSwedenSwitzerlandSyriaTaiwanThailandTrinidad and TobagoTurkeyUgandaUkraineUruguayUzbekistanVenezuelaVietnamWest IndiesWestern AfricaWestern AsiaWestern EuropeYemenZaireZimbabweAzores
Unemployment Among Ages 25 to 29 years
Income
Poverty
Unemployment
Labor Participation
Family Structure
Vehicle Availability
Education Level
Disability

Unemployment Among Ages 25 to 29 years Comparison

Immigrants from Honduras

Okinawans

Tragic
Exceptional
7.0%
UNEMPLOYMENT AMONG AGES 25 TO 29 YEARS
2.4/ 100
METRIC RATING
233rd/ 347
METRIC RANK
5.9%
UNEMPLOYMENT AMONG AGES 25 TO 29 YEARS
100.0/ 100
METRIC RATING
12th/ 347
METRIC RANK

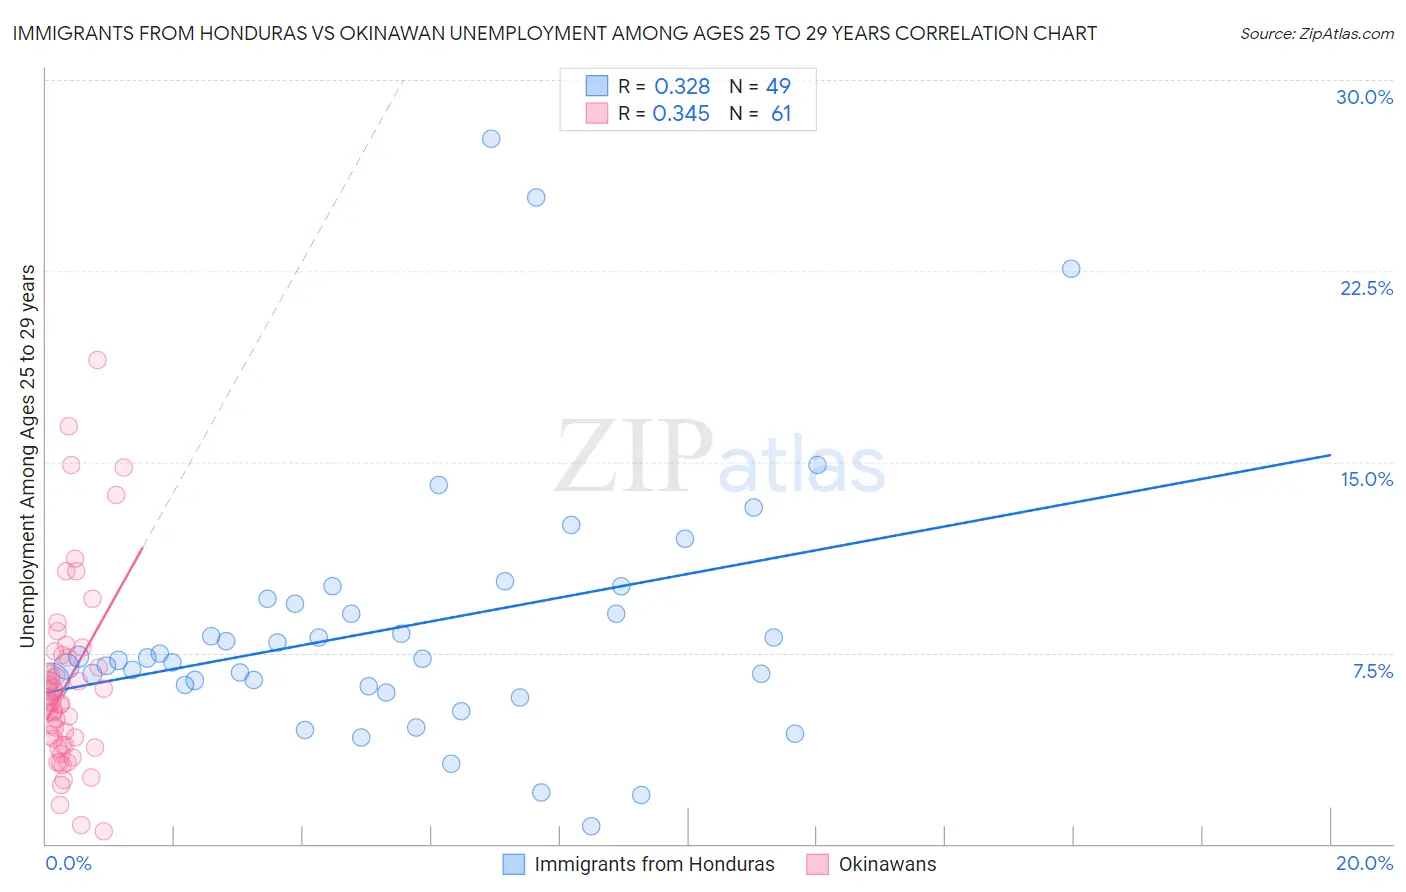
Immigrants from Honduras vs Okinawan Unemployment Among Ages 25 to 29 years Correlation Chart

The statistical analysis conducted on geographies consisting of 312,242,306 people shows a mild positive correlation between the proportion of Immigrants from Honduras and unemployment rate among population between the ages 25 and 29 in the United States with a correlation coefficient (R) of 0.328 and weighted average of 7.0%. Similarly, the statistical analysis conducted on geographies consisting of 73,094,975 people shows a mild positive correlation between the proportion of Okinawans and unemployment rate among population between the ages 25 and 29 in the United States with a correlation coefficient (R) of 0.345 and weighted average of 5.9%, a difference of 20.1%.
Immigrants from Honduras vs Okinawan Unemployment Among Ages 25 to 29 years

Unemployment Among Ages 25 to 29 years Correlation Summary

MeasurementImmigrants from HondurasOkinawan
Minimum0.70%0.50%
Maximum27.7%19.0%
Range27.0%18.5%
Mean8.5%6.3%
Median7.3%5.6%
Interquartile 25% (IQ1)6.2%3.9%
Interquartile 75% (IQ3)9.5%7.4%
Interquartile Range (IQR)3.3%3.5%
Standard Deviation (Sample)5.2%3.7%
Standard Deviation (Population)5.2%3.6%

Similar Demographics by Unemployment Among Ages 25 to 29 years

Demographics Similar to Immigrants from Honduras by Unemployment Among Ages 25 to 29 years

In terms of unemployment among ages 25 to 29 years, the demographic groups most similar to Immigrants from Honduras are French Canadian (7.0%, a difference of 0.020%), Panamanian (7.0%, a difference of 0.18%), Spanish American (7.0%, a difference of 0.19%), Cape Verdean (7.0%, a difference of 0.32%), and Central American (7.0%, a difference of 0.34%).
DemographicsRating | RankUnemployment Among Ages 25 to 29 years
Immigrants | Liberia
4.8
/100
|
#226
Tragic
7.0%
Salvadorans
4.4
/100
|
#227
Tragic
7.0%
Immigrants | Panama
4.2
/100
|
#228
Tragic
7.0%
Bermudans
3.8
/100
|
#229
Tragic
7.0%
Immigrants | El Salvador
3.6
/100
|
#230
Tragic
7.0%
Central Americans
3.0
/100
|
#231
Tragic
7.0%
Spanish Americans
2.7
/100
|
#232
Tragic
7.0%
Immigrants | Honduras
2.4
/100
|
#233
Tragic
7.0%
French Canadians
2.4
/100
|
#234
Tragic
7.0%
Panamanians
2.1
/100
|
#235
Tragic
7.0%
Cape Verdeans
1.9
/100
|
#236
Tragic
7.0%
Puget Sound Salish
1.8
/100
|
#237
Tragic
7.1%
Hondurans
1.8
/100
|
#238
Tragic
7.1%
Potawatomi
1.3
/100
|
#239
Tragic
7.1%
Native Hawaiians
1.3
/100
|
#240
Tragic
7.1%

Demographics Similar to Okinawans by Unemployment Among Ages 25 to 29 years

In terms of unemployment among ages 25 to 29 years, the demographic groups most similar to Okinawans are Immigrants from Bolivia (5.9%, a difference of 0.030%), Cambodian (5.8%, a difference of 0.12%), Immigrants from Kuwait (5.9%, a difference of 0.65%), Cuban (5.9%, a difference of 1.0%), and Immigrants from Bulgaria (5.9%, a difference of 1.0%).
DemographicsRating | RankUnemployment Among Ages 25 to 29 years
Somalis
100.0
/100
|
#5
Exceptional
5.6%
Hmong
100.0
/100
|
#6
Exceptional
5.7%
Immigrants | India
100.0
/100
|
#7
Exceptional
5.7%
Immigrants | Bosnia and Herzegovina
100.0
/100
|
#8
Exceptional
5.7%
Immigrants | Nepal
100.0
/100
|
#9
Exceptional
5.7%
Immigrants | Sudan
100.0
/100
|
#10
Exceptional
5.8%
Cambodians
100.0
/100
|
#11
Exceptional
5.8%
Okinawans
100.0
/100
|
#12
Exceptional
5.9%
Immigrants | Bolivia
100.0
/100
|
#13
Exceptional
5.9%
Immigrants | Kuwait
99.9
/100
|
#14
Exceptional
5.9%
Cubans
99.9
/100
|
#15
Exceptional
5.9%
Immigrants | Bulgaria
99.9
/100
|
#16
Exceptional
5.9%
Bolivians
99.9
/100
|
#17
Exceptional
5.9%
Immigrants | Singapore
99.9
/100
|
#18
Exceptional
5.9%
Thais
99.9
/100
|
#19
Exceptional
5.9%