Immigrants from Syria vs Bermudan Disability Age Under 5
COMPARE
Immigrants from Syria
Bermudan
Disability Age Under 5
Disability Age Under 5 Comparison
Immigrants from Syria
Bermudans
1.1%
DISABILITY AGE UNDER 5
97.9/ 100
METRIC RATING
83rd/ 347
METRIC RANK
1.4%
DISABILITY AGE UNDER 5
1.0/ 100
METRIC RATING
249th/ 347
METRIC RANK
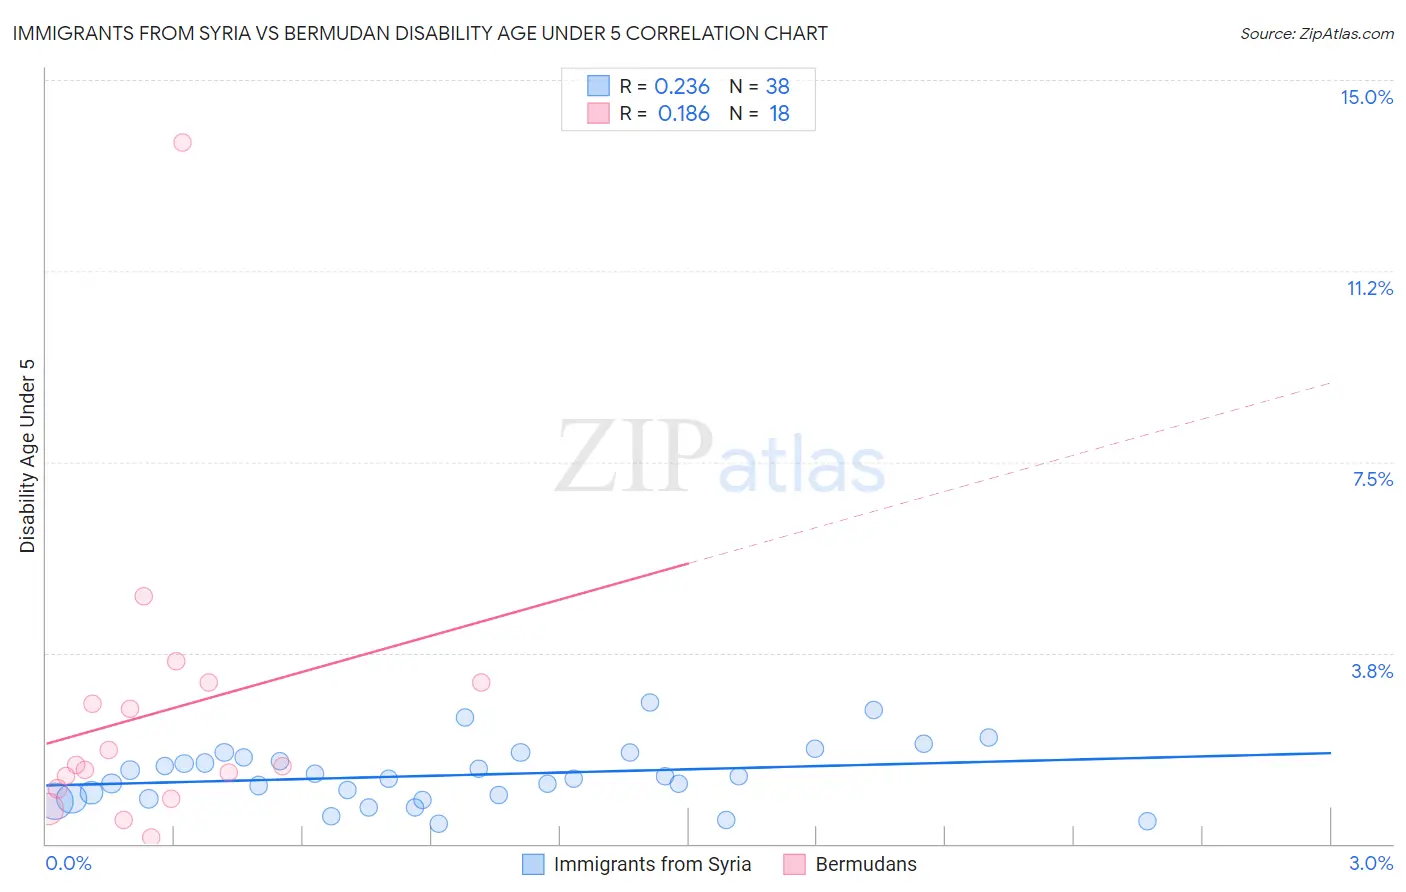
Immigrants from Syria vs Bermudan Disability Age Under 5 Correlation Chart
The statistical analysis conducted on geographies consisting of 121,605,651 people shows a weak positive correlation between the proportion of Immigrants from Syria and percentage of population with a disability under the age of 5 in the United States with a correlation coefficient (R) of 0.236 and weighted average of 1.1%. Similarly, the statistical analysis conducted on geographies consisting of 46,313,673 people shows a poor positive correlation between the proportion of Bermudans and percentage of population with a disability under the age of 5 in the United States with a correlation coefficient (R) of 0.186 and weighted average of 1.4%, a difference of 20.9%.
Disability Age Under 5 Correlation Summary
| Measurement | Immigrants from Syria | Bermudan |
| Minimum | 0.39% | 0.12% |
| Maximum | 2.8% | 13.8% |
| Range | 2.4% | 13.6% |
| Mean | 1.3% | 2.6% |
| Median | 1.3% | 1.5% |
| Interquartile 25% (IQ1) | 0.88% | 1.1% |
| Interquartile 75% (IQ3) | 1.7% | 3.2% |
| Interquartile Range (IQR) | 0.81% | 2.1% |
| Standard Deviation (Sample) | 0.58% | 3.1% |
| Standard Deviation (Population) | 0.57% | 3.0% |
Similar Demographics by Disability Age Under 5
Demographics Similar to Immigrants from Syria by Disability Age Under 5
In terms of disability age under 5, the demographic groups most similar to Immigrants from Syria are Immigrants from Jordan (1.1%, a difference of 0.010%), Turkish (1.1%, a difference of 0.12%), Immigrants from Trinidad and Tobago (1.1%, a difference of 0.14%), Immigrants from Zaire (1.1%, a difference of 0.15%), and Hmong (1.1%, a difference of 0.16%).
| Demographics | Rating | Rank | Disability Age Under 5 |
| Immigrants | Burma/Myanmar | 98.2 /100 | #76 | Exceptional 1.1% |
| Immigrants | Denmark | 98.1 /100 | #77 | Exceptional 1.1% |
| West Indians | 98.0 /100 | #78 | Exceptional 1.1% |
| Hmong | 98.0 /100 | #79 | Exceptional 1.1% |
| Immigrants | Trinidad and Tobago | 98.0 /100 | #80 | Exceptional 1.1% |
| Turks | 98.0 /100 | #81 | Exceptional 1.1% |
| Immigrants | Jordan | 97.9 /100 | #82 | Exceptional 1.1% |
| Immigrants | Syria | 97.9 /100 | #83 | Exceptional 1.1% |
| Immigrants | Zaire | 97.8 /100 | #84 | Exceptional 1.1% |
| Sudanese | 97.7 /100 | #85 | Exceptional 1.1% |
| Okinawans | 97.6 /100 | #86 | Exceptional 1.1% |
| Ugandans | 97.5 /100 | #87 | Exceptional 1.1% |
| Immigrants | Dominican Republic | 97.5 /100 | #88 | Exceptional 1.1% |
| Ethiopians | 97.2 /100 | #89 | Exceptional 1.1% |
| Chinese | 97.2 /100 | #90 | Exceptional 1.1% |
Demographics Similar to Bermudans by Disability Age Under 5
In terms of disability age under 5, the demographic groups most similar to Bermudans are African (1.4%, a difference of 0.010%), Immigrants from Hungary (1.4%, a difference of 0.040%), Eastern European (1.4%, a difference of 0.080%), Immigrants from Scotland (1.4%, a difference of 0.080%), and Immigrants from England (1.4%, a difference of 0.11%).
| Demographics | Rating | Rank | Disability Age Under 5 |
| Lumbee | 2.1 /100 | #242 | Tragic 1.3% |
| Immigrants | Cameroon | 1.7 /100 | #243 | Tragic 1.4% |
| Spaniards | 1.4 /100 | #244 | Tragic 1.4% |
| Potawatomi | 1.1 /100 | #245 | Tragic 1.4% |
| Russians | 1.0 /100 | #246 | Tragic 1.4% |
| Immigrants | England | 1.0 /100 | #247 | Tragic 1.4% |
| Eastern Europeans | 1.0 /100 | #248 | Tragic 1.4% |
| Bermudans | 1.0 /100 | #249 | Tragic 1.4% |
| Africans | 1.0 /100 | #250 | Tragic 1.4% |
| Immigrants | Hungary | 1.0 /100 | #251 | Tragic 1.4% |
| Immigrants | Scotland | 0.9 /100 | #252 | Tragic 1.4% |
| Australians | 0.7 /100 | #253 | Tragic 1.4% |
| Immigrants | Brazil | 0.7 /100 | #254 | Tragic 1.4% |
| Immigrants | Liberia | 0.6 /100 | #255 | Tragic 1.4% |
| Immigrants | Western Europe | 0.5 /100 | #256 | Tragic 1.4% |