Immigrants from Guyana vs Crow Seniors Poverty Over the Age of 75
COMPARE
Immigrants from Guyana
Crow
Seniors Poverty Over the Age of 75
Seniors Poverty Over the Age of 75 Comparison
Immigrants from Guyana
Crow
16.2%
SENIORS POVERTY OVER THE AGE OF 75
0.0/ 100
METRIC RATING
317th/ 347
METRIC RANK
15.9%
SENIORS POVERTY OVER THE AGE OF 75
0.0/ 100
METRIC RATING
312th/ 347
METRIC RANK
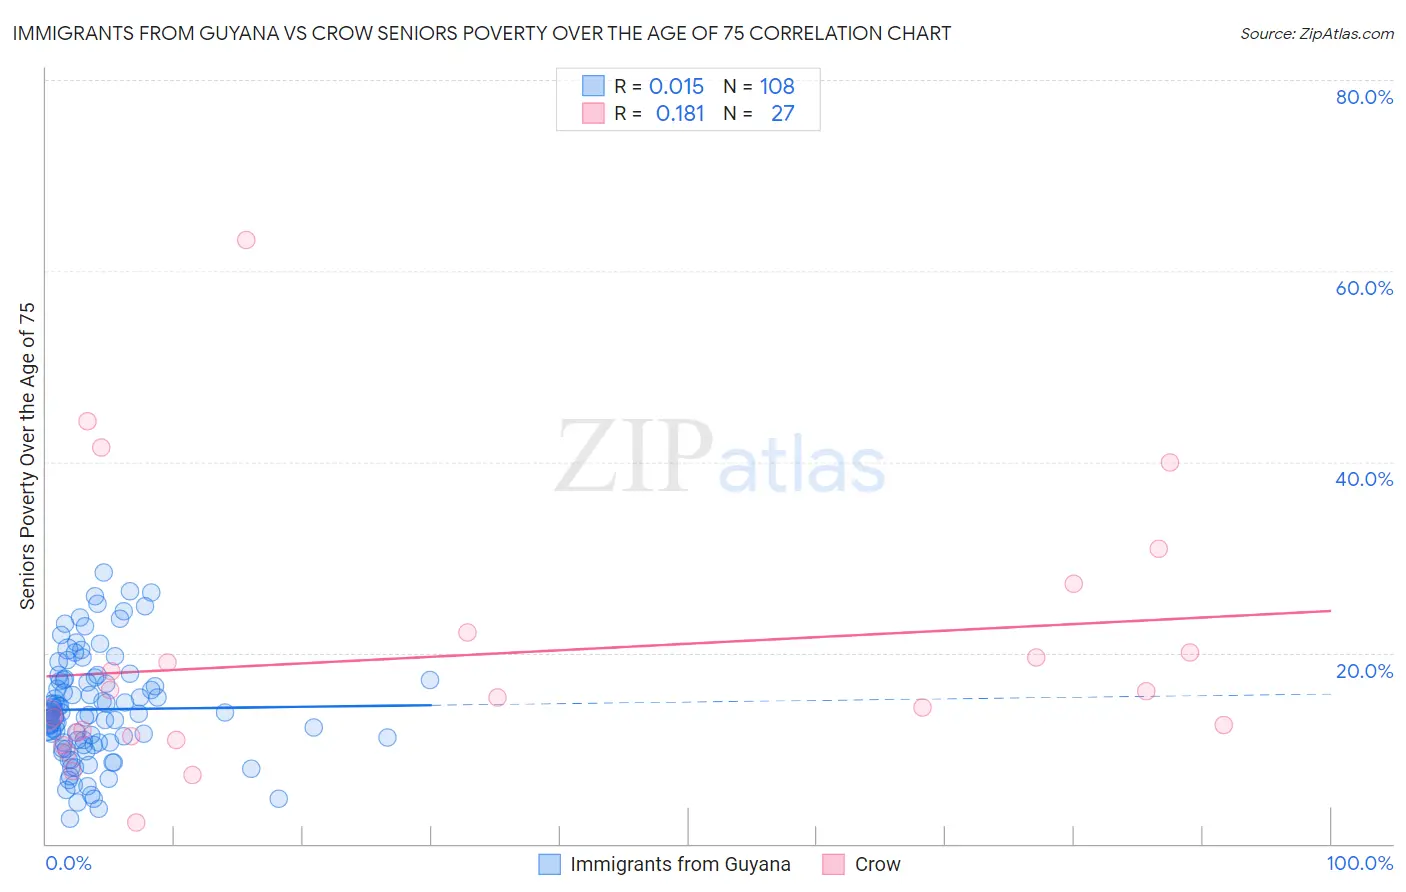
Immigrants from Guyana vs Crow Seniors Poverty Over the Age of 75 Correlation Chart
The statistical analysis conducted on geographies consisting of 182,494,959 people shows no correlation between the proportion of Immigrants from Guyana and poverty level among seniors over the age of 75 in the United States with a correlation coefficient (R) of 0.015 and weighted average of 16.2%. Similarly, the statistical analysis conducted on geographies consisting of 58,947,142 people shows a poor positive correlation between the proportion of Crow and poverty level among seniors over the age of 75 in the United States with a correlation coefficient (R) of 0.181 and weighted average of 15.9%, a difference of 1.8%.
Seniors Poverty Over the Age of 75 Correlation Summary
| Measurement | Immigrants from Guyana | Crow |
| Minimum | 2.7% | 2.2% |
| Maximum | 28.5% | 63.2% |
| Range | 25.8% | 61.0% |
| Mean | 14.1% | 19.6% |
| Median | 13.6% | 15.3% |
| Interquartile 25% (IQ1) | 10.6% | 11.2% |
| Interquartile 75% (IQ3) | 17.1% | 22.1% |
| Interquartile Range (IQR) | 6.5% | 10.9% |
| Standard Deviation (Sample) | 5.6% | 13.7% |
| Standard Deviation (Population) | 5.5% | 13.4% |
Demographics Similar to Immigrants from Guyana and Crow by Seniors Poverty Over the Age of 75
In terms of seniors poverty over the age of 75, the demographic groups most similar to Immigrants from Guyana are Houma (16.2%, a difference of 0.13%), Haitian (16.2%, a difference of 0.17%), Immigrants from Ecuador (16.1%, a difference of 0.61%), Guyanese (16.1%, a difference of 0.62%), and Tsimshian (16.1%, a difference of 0.93%). Similarly, the demographic groups most similar to Crow are Trinidadian and Tobagonian (15.9%, a difference of 0.41%), Barbadian (16.0%, a difference of 0.47%), Vietnamese (15.9%, a difference of 0.51%), Yup'ik (15.8%, a difference of 0.61%), and Tsimshian (16.1%, a difference of 0.83%).
| Demographics | Rating | Rank | Seniors Poverty Over the Age of 75 |
| Immigrants | Trinidad and Tobago | 0.0 /100 | #304 | Tragic 15.7% |
| Ecuadorians | 0.0 /100 | #305 | Tragic 15.7% |
| Hispanics or Latinos | 0.0 /100 | #306 | Tragic 15.8% |
| Immigrants | West Indies | 0.0 /100 | #307 | Tragic 15.8% |
| Immigrants | Bangladesh | 0.0 /100 | #308 | Tragic 15.8% |
| Yup'ik | 0.0 /100 | #309 | Tragic 15.8% |
| Vietnamese | 0.0 /100 | #310 | Tragic 15.9% |
| Trinidadians and Tobagonians | 0.0 /100 | #311 | Tragic 15.9% |
| Crow | 0.0 /100 | #312 | Tragic 15.9% |
| Barbadians | 0.0 /100 | #313 | Tragic 16.0% |
| Tsimshian | 0.0 /100 | #314 | Tragic 16.1% |
| Guyanese | 0.0 /100 | #315 | Tragic 16.1% |
| Immigrants | Ecuador | 0.0 /100 | #316 | Tragic 16.1% |
| Immigrants | Guyana | 0.0 /100 | #317 | Tragic 16.2% |
| Houma | 0.0 /100 | #318 | Tragic 16.2% |
| Haitians | 0.0 /100 | #319 | Tragic 16.2% |
| Immigrants | Yemen | 0.0 /100 | #320 | Tragic 16.5% |
| Immigrants | Haiti | 0.0 /100 | #321 | Tragic 16.5% |
| Immigrants | Barbados | 0.0 /100 | #322 | Tragic 16.5% |
| Central American Indians | 0.0 /100 | #323 | Tragic 16.5% |
| Immigrants | Uzbekistan | 0.0 /100 | #324 | Tragic 16.5% |