Immigrants from Guyana vs Immigrants from Uzbekistan Female Disability
COMPARE
Immigrants from Guyana
Immigrants from Uzbekistan
Female Disability
Female Disability Comparison
Immigrants from Guyana
Immigrants from Uzbekistan
12.2%
FEMALE DISABILITY
43.1/ 100
METRIC RATING
176th/ 347
METRIC RANK
12.3%
FEMALE DISABILITY
33.9/ 100
METRIC RATING
185th/ 347
METRIC RANK
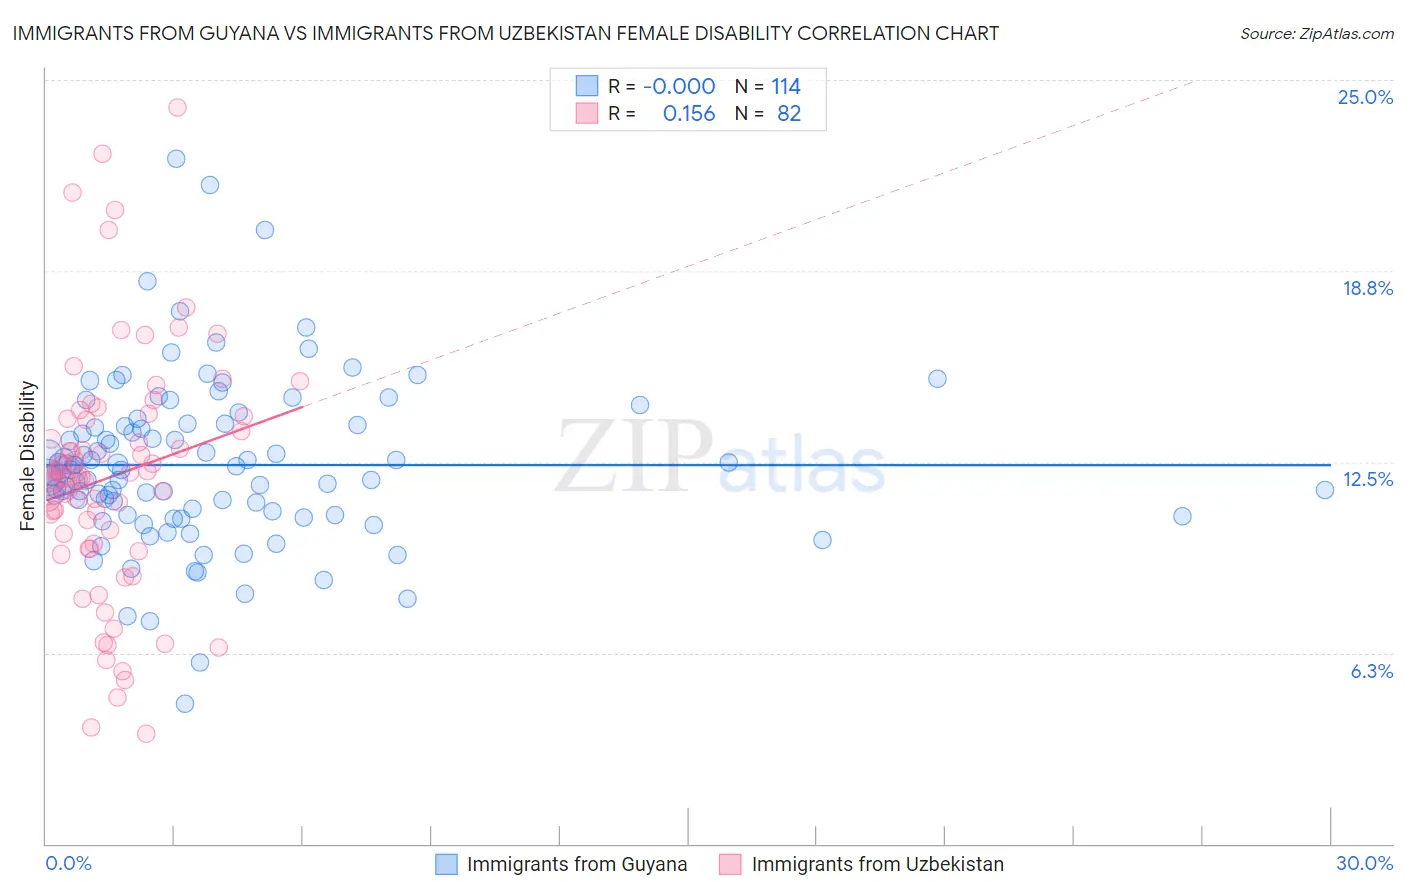
Immigrants from Guyana vs Immigrants from Uzbekistan Female Disability Correlation Chart
The statistical analysis conducted on geographies consisting of 183,713,039 people shows no correlation between the proportion of Immigrants from Guyana and percentage of females with a disability in the United States with a correlation coefficient (R) of -0.000 and weighted average of 12.2%. Similarly, the statistical analysis conducted on geographies consisting of 118,753,500 people shows a poor positive correlation between the proportion of Immigrants from Uzbekistan and percentage of females with a disability in the United States with a correlation coefficient (R) of 0.156 and weighted average of 12.3%, a difference of 0.37%.
Female Disability Correlation Summary
| Measurement | Immigrants from Guyana | Immigrants from Uzbekistan |
| Minimum | 4.6% | 3.6% |
| Maximum | 22.4% | 24.1% |
| Range | 17.8% | 20.5% |
| Mean | 12.4% | 12.0% |
| Median | 12.2% | 12.0% |
| Interquartile 25% (IQ1) | 10.8% | 9.8% |
| Interquartile 75% (IQ3) | 13.7% | 13.9% |
| Interquartile Range (IQR) | 2.9% | 4.1% |
| Standard Deviation (Sample) | 2.7% | 4.0% |
| Standard Deviation (Population) | 2.7% | 3.9% |
Demographics Similar to Immigrants from Guyana and Immigrants from Uzbekistan by Female Disability
In terms of female disability, the demographic groups most similar to Immigrants from Guyana are Immigrants from Ghana (12.2%, a difference of 0.030%), Immigrants from Western Europe (12.2%, a difference of 0.080%), Immigrants from Fiji (12.3%, a difference of 0.19%), Albanian (12.3%, a difference of 0.20%), and Immigrants from Canada (12.3%, a difference of 0.23%). Similarly, the demographic groups most similar to Immigrants from Uzbekistan are Austrian (12.3%, a difference of 0.020%), Serbian (12.3%, a difference of 0.030%), Immigrants from North America (12.3%, a difference of 0.050%), Iraqi (12.3%, a difference of 0.080%), and Cuban (12.3%, a difference of 0.10%).
| Demographics | Rating | Rank | Female Disability |
| Maltese | 57.0 /100 | #170 | Average 12.2% |
| Immigrants | Southern Europe | 56.3 /100 | #171 | Average 12.2% |
| Haitians | 51.9 /100 | #172 | Average 12.2% |
| Immigrants | Mexico | 50.8 /100 | #173 | Average 12.2% |
| Immigrants | England | 50.0 /100 | #174 | Average 12.2% |
| Immigrants | St. Vincent and the Grenadines | 49.7 /100 | #175 | Average 12.2% |
| Immigrants | Guyana | 43.1 /100 | #176 | Average 12.2% |
| Immigrants | Ghana | 42.5 /100 | #177 | Average 12.2% |
| Immigrants | Western Europe | 40.9 /100 | #178 | Average 12.2% |
| Immigrants | Fiji | 38.2 /100 | #179 | Fair 12.3% |
| Albanians | 37.9 /100 | #180 | Fair 12.3% |
| Immigrants | Canada | 37.2 /100 | #181 | Fair 12.3% |
| Norwegians | 36.9 /100 | #182 | Fair 12.3% |
| Cubans | 36.5 /100 | #183 | Fair 12.3% |
| Iraqis | 36.0 /100 | #184 | Fair 12.3% |
| Immigrants | Uzbekistan | 33.9 /100 | #185 | Fair 12.3% |
| Austrians | 33.3 /100 | #186 | Fair 12.3% |
| Serbians | 33.1 /100 | #187 | Fair 12.3% |
| Immigrants | North America | 32.8 /100 | #188 | Fair 12.3% |
| Immigrants | Albania | 31.6 /100 | #189 | Fair 12.3% |
| Immigrants | Honduras | 31.3 /100 | #190 | Fair 12.3% |