Immigrants from Guyana vs Australian Disability Age 35 to 64
COMPARE
Immigrants from Guyana
Australian
Disability Age 35 to 64
Disability Age 35 to 64 Comparison
Immigrants from Guyana
Australians
11.1%
DISABILITY AGE 35 TO 64
70.1/ 100
METRIC RATING
161st/ 347
METRIC RANK
10.8%
DISABILITY AGE 35 TO 64
90.7/ 100
METRIC RATING
141st/ 347
METRIC RANK
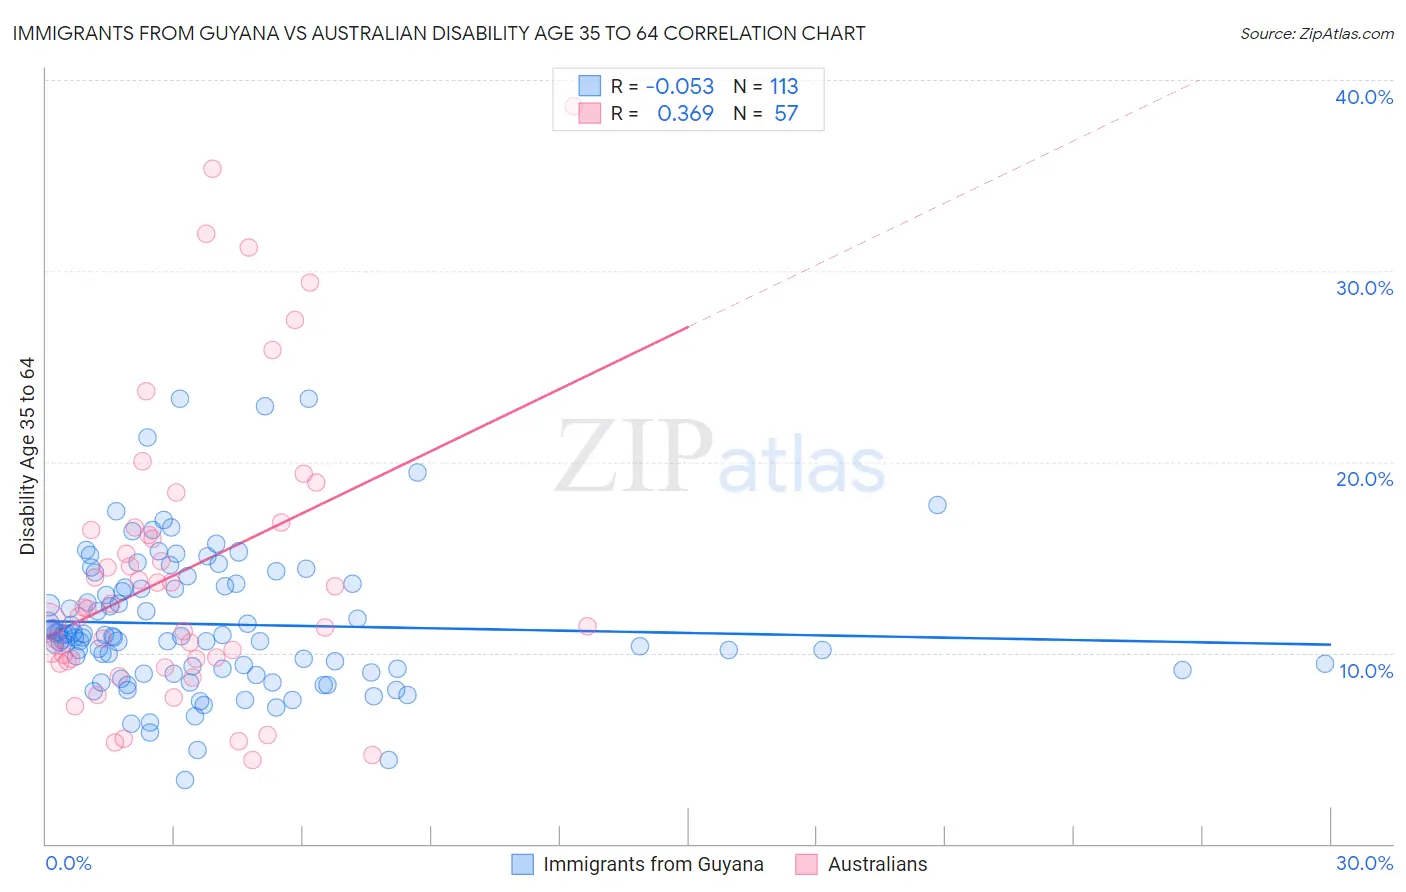
Immigrants from Guyana vs Australian Disability Age 35 to 64 Correlation Chart
The statistical analysis conducted on geographies consisting of 183,673,552 people shows a slight negative correlation between the proportion of Immigrants from Guyana and percentage of population with a disability between the ages 34 and 64 in the United States with a correlation coefficient (R) of -0.053 and weighted average of 11.1%. Similarly, the statistical analysis conducted on geographies consisting of 224,011,363 people shows a mild positive correlation between the proportion of Australians and percentage of population with a disability between the ages 34 and 64 in the United States with a correlation coefficient (R) of 0.369 and weighted average of 10.8%, a difference of 3.0%.
Disability Age 35 to 64 Correlation Summary
| Measurement | Immigrants from Guyana | Australian |
| Minimum | 3.3% | 4.4% |
| Maximum | 23.3% | 38.6% |
| Range | 20.0% | 34.3% |
| Mean | 11.5% | 14.3% |
| Median | 10.9% | 12.3% |
| Interquartile 25% (IQ1) | 9.0% | 9.6% |
| Interquartile 75% (IQ3) | 13.5% | 16.5% |
| Interquartile Range (IQR) | 4.5% | 6.9% |
| Standard Deviation (Sample) | 3.7% | 7.7% |
| Standard Deviation (Population) | 3.7% | 7.7% |
Demographics Similar to Immigrants from Guyana and Australians by Disability Age 35 to 64
In terms of disability age 35 to 64, the demographic groups most similar to Immigrants from Guyana are Croatian (11.0%, a difference of 0.30%), Serbian (11.0%, a difference of 0.36%), Immigrants from North America (11.0%, a difference of 0.50%), Guyanese (11.0%, a difference of 0.51%), and Immigrants from Sierra Leone (11.0%, a difference of 0.64%). Similarly, the demographic groups most similar to Australians are Immigrants from Saudi Arabia (10.8%, a difference of 0.040%), Sierra Leonean (10.8%, a difference of 0.25%), Lithuanian (10.8%, a difference of 0.46%), Immigrants from Bangladesh (10.9%, a difference of 1.1%), and South American Indian (10.9%, a difference of 1.4%).
| Demographics | Rating | Rank | Disability Age 35 to 64 |
| Australians | 90.7 /100 | #141 | Exceptional 10.8% |
| Immigrants | Saudi Arabia | 90.6 /100 | #142 | Exceptional 10.8% |
| Sierra Leoneans | 89.7 /100 | #143 | Excellent 10.8% |
| Lithuanians | 88.7 /100 | #144 | Excellent 10.8% |
| Immigrants | Bangladesh | 85.6 /100 | #145 | Excellent 10.9% |
| South American Indians | 83.5 /100 | #146 | Excellent 10.9% |
| Immigrants | Eritrea | 83.4 /100 | #147 | Excellent 10.9% |
| Arabs | 82.7 /100 | #148 | Excellent 10.9% |
| Immigrants | Cameroon | 81.1 /100 | #149 | Excellent 10.9% |
| Syrians | 79.8 /100 | #150 | Good 11.0% |
| New Zealanders | 79.3 /100 | #151 | Good 11.0% |
| Ukrainians | 78.0 /100 | #152 | Good 11.0% |
| Immigrants | England | 77.4 /100 | #153 | Good 11.0% |
| Immigrants | Canada | 76.7 /100 | #154 | Good 11.0% |
| Moroccans | 76.4 /100 | #155 | Good 11.0% |
| Immigrants | Sierra Leone | 76.2 /100 | #156 | Good 11.0% |
| Guyanese | 75.1 /100 | #157 | Good 11.0% |
| Immigrants | North America | 74.9 /100 | #158 | Good 11.0% |
| Serbians | 73.6 /100 | #159 | Good 11.0% |
| Croatians | 73.1 /100 | #160 | Good 11.0% |
| Immigrants | Guyana | 70.1 /100 | #161 | Good 11.1% |