Immigrants from Kenya vs Australian Disability Age 35 to 64
COMPARE
Immigrants from Kenya
Australian
Disability Age 35 to 64
Disability Age 35 to 64 Comparison
Immigrants from Kenya
Australians
11.6%
DISABILITY AGE 35 TO 64
17.7/ 100
METRIC RATING
201st/ 347
METRIC RANK
10.8%
DISABILITY AGE 35 TO 64
90.7/ 100
METRIC RATING
141st/ 347
METRIC RANK
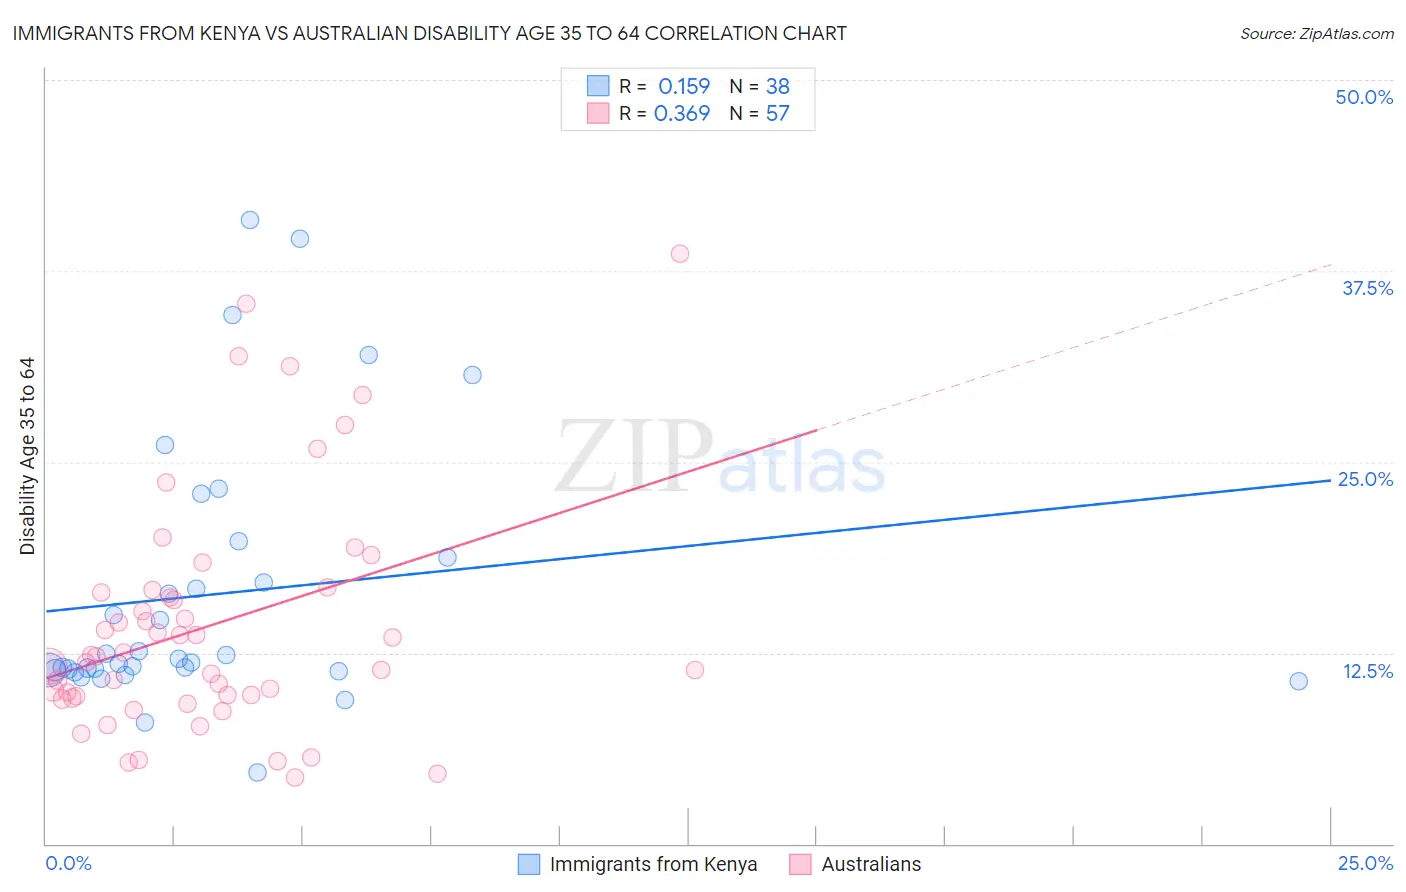
Immigrants from Kenya vs Australian Disability Age 35 to 64 Correlation Chart
The statistical analysis conducted on geographies consisting of 217,981,041 people shows a poor positive correlation between the proportion of Immigrants from Kenya and percentage of population with a disability between the ages 34 and 64 in the United States with a correlation coefficient (R) of 0.159 and weighted average of 11.6%. Similarly, the statistical analysis conducted on geographies consisting of 224,011,363 people shows a mild positive correlation between the proportion of Australians and percentage of population with a disability between the ages 34 and 64 in the United States with a correlation coefficient (R) of 0.369 and weighted average of 10.8%, a difference of 8.0%.
Disability Age 35 to 64 Correlation Summary
| Measurement | Immigrants from Kenya | Australian |
| Minimum | 4.6% | 4.4% |
| Maximum | 40.9% | 38.6% |
| Range | 36.2% | 34.3% |
| Mean | 16.3% | 14.3% |
| Median | 12.0% | 12.3% |
| Interquartile 25% (IQ1) | 11.4% | 9.6% |
| Interquartile 75% (IQ3) | 18.8% | 16.5% |
| Interquartile Range (IQR) | 7.4% | 6.9% |
| Standard Deviation (Sample) | 8.8% | 7.7% |
| Standard Deviation (Population) | 8.7% | 7.7% |
Similar Demographics by Disability Age 35 to 64
Demographics Similar to Immigrants from Kenya by Disability Age 35 to 64
In terms of disability age 35 to 64, the demographic groups most similar to Immigrants from Kenya are Immigrants from Guatemala (11.6%, a difference of 0.020%), British (11.6%, a difference of 0.090%), Swiss (11.6%, a difference of 0.13%), Nigerian (11.6%, a difference of 0.20%), and Basque (11.6%, a difference of 0.23%).
| Demographics | Rating | Rank | Disability Age 35 to 64 |
| Immigrants | Latin America | 27.5 /100 | #194 | Fair 11.5% |
| Carpatho Rusyns | 25.3 /100 | #195 | Fair 11.5% |
| Iraqis | 24.2 /100 | #196 | Fair 11.5% |
| Immigrants | Iraq | 21.0 /100 | #197 | Fair 11.6% |
| Immigrants | Panama | 20.4 /100 | #198 | Fair 11.6% |
| Basques | 19.5 /100 | #199 | Poor 11.6% |
| Swiss | 18.7 /100 | #200 | Poor 11.6% |
| Immigrants | Kenya | 17.7 /100 | #201 | Poor 11.6% |
| Immigrants | Guatemala | 17.5 /100 | #202 | Poor 11.6% |
| British | 17.0 /100 | #203 | Poor 11.6% |
| Nigerians | 16.3 /100 | #204 | Poor 11.6% |
| Slavs | 15.5 /100 | #205 | Poor 11.7% |
| Native Hawaiians | 14.8 /100 | #206 | Poor 11.7% |
| Ghanaians | 14.8 /100 | #207 | Poor 11.7% |
| Guatemalans | 14.6 /100 | #208 | Poor 11.7% |
Demographics Similar to Australians by Disability Age 35 to 64
In terms of disability age 35 to 64, the demographic groups most similar to Australians are Immigrants from Saudi Arabia (10.8%, a difference of 0.040%), Immigrants from Scotland (10.7%, a difference of 0.13%), Costa Rican (10.7%, a difference of 0.18%), Immigrants from Southern Europe (10.7%, a difference of 0.19%), and Immigrants from Costa Rica (10.7%, a difference of 0.25%).
| Demographics | Rating | Rank | Disability Age 35 to 64 |
| Immigrants | Ecuador | 92.5 /100 | #134 | Exceptional 10.7% |
| Greeks | 92.3 /100 | #135 | Exceptional 10.7% |
| Salvadorans | 91.9 /100 | #136 | Exceptional 10.7% |
| Immigrants | Costa Rica | 91.7 /100 | #137 | Exceptional 10.7% |
| Immigrants | Southern Europe | 91.5 /100 | #138 | Exceptional 10.7% |
| Costa Ricans | 91.4 /100 | #139 | Exceptional 10.7% |
| Immigrants | Scotland | 91.3 /100 | #140 | Exceptional 10.7% |
| Australians | 90.7 /100 | #141 | Exceptional 10.8% |
| Immigrants | Saudi Arabia | 90.6 /100 | #142 | Exceptional 10.8% |
| Sierra Leoneans | 89.7 /100 | #143 | Excellent 10.8% |
| Lithuanians | 88.7 /100 | #144 | Excellent 10.8% |
| Immigrants | Bangladesh | 85.6 /100 | #145 | Excellent 10.9% |
| South American Indians | 83.5 /100 | #146 | Excellent 10.9% |
| Immigrants | Eritrea | 83.4 /100 | #147 | Excellent 10.9% |
| Arabs | 82.7 /100 | #148 | Excellent 10.9% |