Immigrants from Guyana vs Moroccan Disability Age 35 to 64
COMPARE
Immigrants from Guyana
Moroccan
Disability Age 35 to 64
Disability Age 35 to 64 Comparison
Immigrants from Guyana
Moroccans
11.1%
DISABILITY AGE 35 TO 64
70.1/ 100
METRIC RATING
161st/ 347
METRIC RANK
11.0%
DISABILITY AGE 35 TO 64
76.4/ 100
METRIC RATING
155th/ 347
METRIC RANK
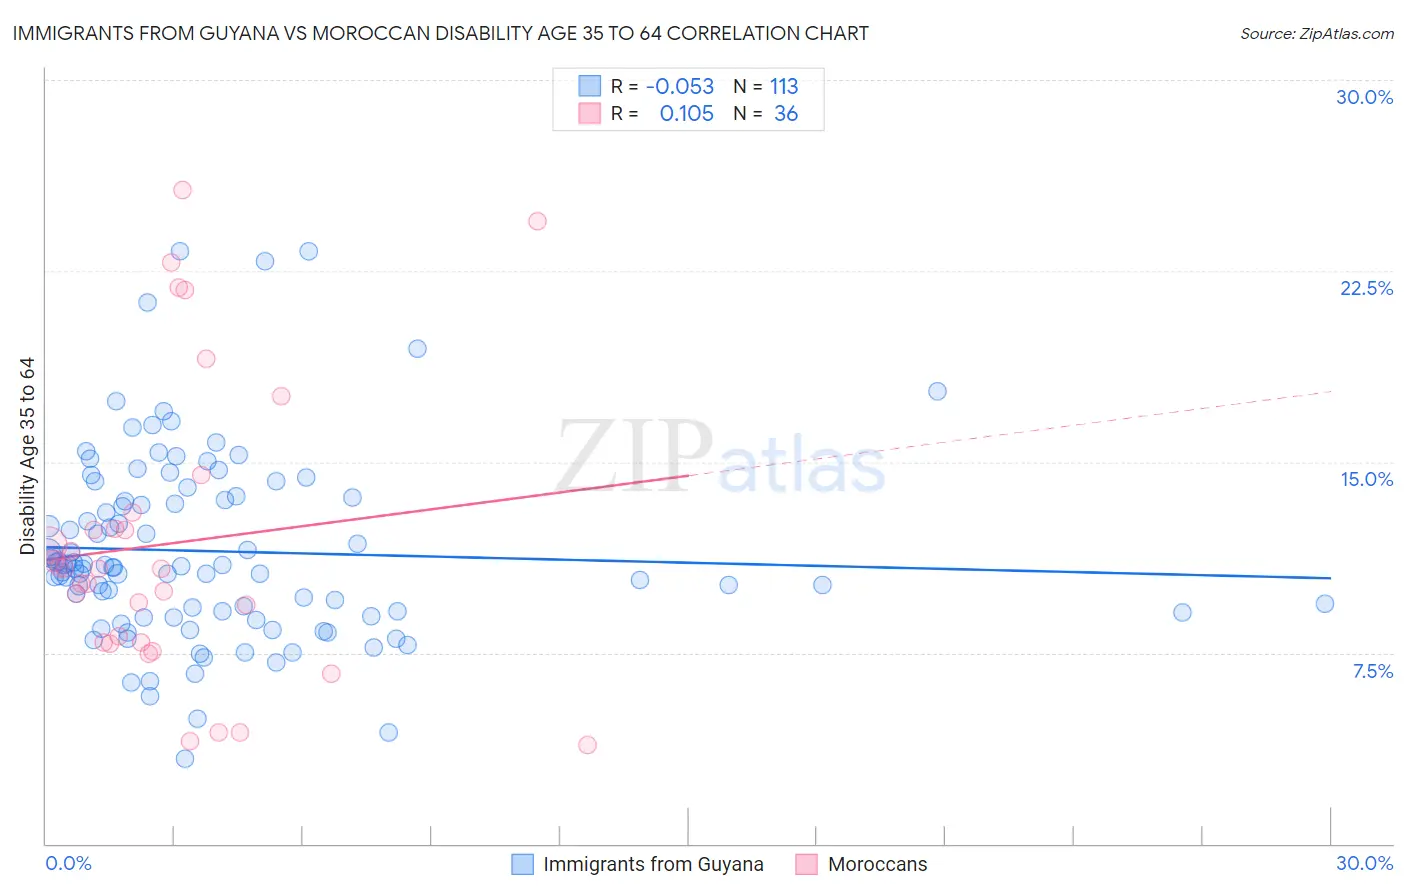
Immigrants from Guyana vs Moroccan Disability Age 35 to 64 Correlation Chart
The statistical analysis conducted on geographies consisting of 183,673,552 people shows a slight negative correlation between the proportion of Immigrants from Guyana and percentage of population with a disability between the ages 34 and 64 in the United States with a correlation coefficient (R) of -0.053 and weighted average of 11.1%. Similarly, the statistical analysis conducted on geographies consisting of 201,754,684 people shows a poor positive correlation between the proportion of Moroccans and percentage of population with a disability between the ages 34 and 64 in the United States with a correlation coefficient (R) of 0.105 and weighted average of 11.0%, a difference of 0.66%.
Disability Age 35 to 64 Correlation Summary
| Measurement | Immigrants from Guyana | Moroccan |
| Minimum | 3.3% | 3.9% |
| Maximum | 23.3% | 25.7% |
| Range | 20.0% | 21.8% |
| Mean | 11.5% | 11.8% |
| Median | 10.9% | 10.8% |
| Interquartile 25% (IQ1) | 9.0% | 7.9% |
| Interquartile 75% (IQ3) | 13.5% | 12.7% |
| Interquartile Range (IQR) | 4.5% | 4.8% |
| Standard Deviation (Sample) | 3.7% | 5.7% |
| Standard Deviation (Population) | 3.7% | 5.7% |
Demographics Similar to Immigrants from Guyana and Moroccans by Disability Age 35 to 64
In terms of disability age 35 to 64, the demographic groups most similar to Immigrants from Guyana are Immigrants from Grenada (11.1%, a difference of 0.17%), Croatian (11.0%, a difference of 0.30%), Immigrants from St. Vincent and the Grenadines (11.1%, a difference of 0.33%), Serbian (11.0%, a difference of 0.36%), and Pakistani (11.1%, a difference of 0.41%). Similarly, the demographic groups most similar to Moroccans are Immigrants from Sierra Leone (11.0%, a difference of 0.020%), Immigrants from Canada (11.0%, a difference of 0.040%), Immigrants from England (11.0%, a difference of 0.11%), Guyanese (11.0%, a difference of 0.15%), and Immigrants from North America (11.0%, a difference of 0.16%).
| Demographics | Rating | Rank | Disability Age 35 to 64 |
| Arabs | 82.7 /100 | #148 | Excellent 10.9% |
| Immigrants | Cameroon | 81.1 /100 | #149 | Excellent 10.9% |
| Syrians | 79.8 /100 | #150 | Good 11.0% |
| New Zealanders | 79.3 /100 | #151 | Good 11.0% |
| Ukrainians | 78.0 /100 | #152 | Good 11.0% |
| Immigrants | England | 77.4 /100 | #153 | Good 11.0% |
| Immigrants | Canada | 76.7 /100 | #154 | Good 11.0% |
| Moroccans | 76.4 /100 | #155 | Good 11.0% |
| Immigrants | Sierra Leone | 76.2 /100 | #156 | Good 11.0% |
| Guyanese | 75.1 /100 | #157 | Good 11.0% |
| Immigrants | North America | 74.9 /100 | #158 | Good 11.0% |
| Serbians | 73.6 /100 | #159 | Good 11.0% |
| Croatians | 73.1 /100 | #160 | Good 11.0% |
| Immigrants | Guyana | 70.1 /100 | #161 | Good 11.1% |
| Immigrants | Grenada | 68.4 /100 | #162 | Good 11.1% |
| Immigrants | St. Vincent and the Grenadines | 66.6 /100 | #163 | Good 11.1% |
| Pakistanis | 65.8 /100 | #164 | Good 11.1% |
| Immigrants | Western Europe | 65.2 /100 | #165 | Good 11.1% |
| Immigrants | Haiti | 63.8 /100 | #166 | Good 11.1% |
| Austrians | 63.2 /100 | #167 | Good 11.1% |
| Central Americans | 59.1 /100 | #168 | Average 11.2% |