Immigrants from Guatemala vs Pueblo Vision Disability
COMPARE
Immigrants from Guatemala
Pueblo
Vision Disability
Vision Disability Comparison
Immigrants from Guatemala
Pueblo
2.4%
VISION DISABILITY
0.3/ 100
METRIC RATING
255th/ 347
METRIC RANK
3.3%
VISION DISABILITY
0.0/ 100
METRIC RATING
344th/ 347
METRIC RANK
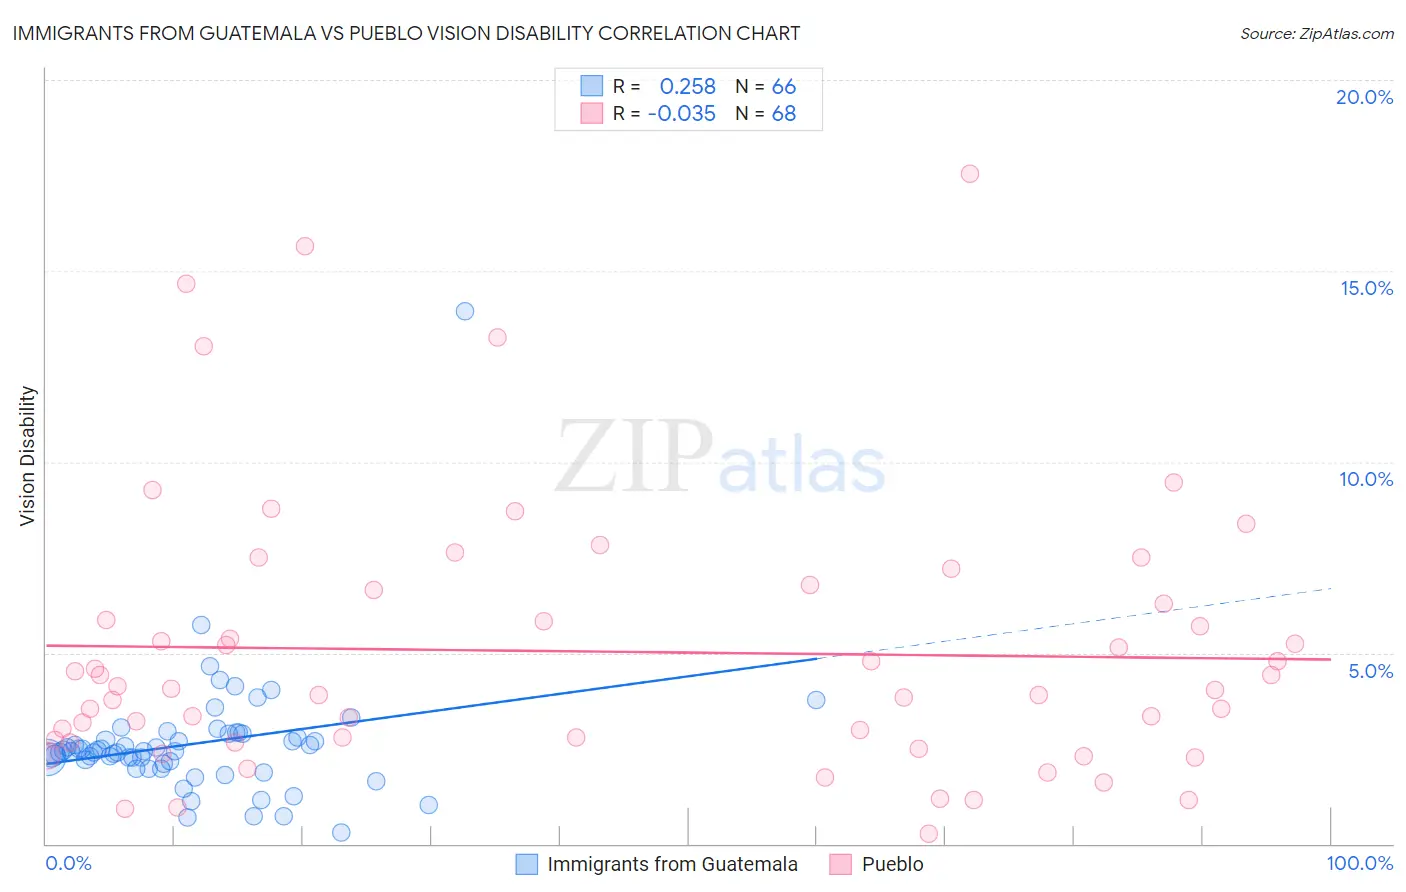
Immigrants from Guatemala vs Pueblo Vision Disability Correlation Chart
The statistical analysis conducted on geographies consisting of 377,092,792 people shows a weak positive correlation between the proportion of Immigrants from Guatemala and percentage of population with vision disability in the United States with a correlation coefficient (R) of 0.258 and weighted average of 2.4%. Similarly, the statistical analysis conducted on geographies consisting of 120,045,963 people shows no correlation between the proportion of Pueblo and percentage of population with vision disability in the United States with a correlation coefficient (R) of -0.035 and weighted average of 3.3%, a difference of 40.7%.
Vision Disability Correlation Summary
| Measurement | Immigrants from Guatemala | Pueblo |
| Minimum | 0.29% | 0.28% |
| Maximum | 14.0% | 17.5% |
| Range | 13.7% | 17.3% |
| Mean | 2.6% | 5.0% |
| Median | 2.4% | 4.0% |
| Interquartile 25% (IQ1) | 2.1% | 2.7% |
| Interquartile 75% (IQ3) | 2.9% | 6.5% |
| Interquartile Range (IQR) | 0.78% | 3.8% |
| Standard Deviation (Sample) | 1.7% | 3.6% |
| Standard Deviation (Population) | 1.7% | 3.5% |
Similar Demographics by Vision Disability
Demographics Similar to Immigrants from Guatemala by Vision Disability
In terms of vision disability, the demographic groups most similar to Immigrants from Guatemala are Haitian (2.4%, a difference of 0.030%), Japanese (2.4%, a difference of 0.31%), Immigrants from Haiti (2.4%, a difference of 0.33%), Immigrants from Micronesia (2.4%, a difference of 0.38%), and West Indian (2.4%, a difference of 0.40%).
| Demographics | Rating | Rank | Vision Disability |
| Sub-Saharan Africans | 0.5 /100 | #248 | Tragic 2.3% |
| Liberians | 0.5 /100 | #249 | Tragic 2.3% |
| Bangladeshis | 0.5 /100 | #250 | Tragic 2.3% |
| Immigrants | Laos | 0.4 /100 | #251 | Tragic 2.4% |
| Immigrants | Micronesia | 0.3 /100 | #252 | Tragic 2.4% |
| Japanese | 0.3 /100 | #253 | Tragic 2.4% |
| Haitians | 0.3 /100 | #254 | Tragic 2.4% |
| Immigrants | Guatemala | 0.3 /100 | #255 | Tragic 2.4% |
| Immigrants | Haiti | 0.2 /100 | #256 | Tragic 2.4% |
| West Indians | 0.2 /100 | #257 | Tragic 2.4% |
| British West Indians | 0.2 /100 | #258 | Tragic 2.4% |
| Whites/Caucasians | 0.2 /100 | #259 | Tragic 2.4% |
| Belizeans | 0.2 /100 | #260 | Tragic 2.4% |
| Fijians | 0.1 /100 | #261 | Tragic 2.4% |
| Jamaicans | 0.1 /100 | #262 | Tragic 2.4% |
Demographics Similar to Pueblo by Vision Disability
In terms of vision disability, the demographic groups most similar to Pueblo are Pima (3.3%, a difference of 0.030%), Choctaw (3.3%, a difference of 1.1%), Lumbee (3.4%, a difference of 1.6%), Kiowa (3.3%, a difference of 2.5%), and Houma (3.4%, a difference of 3.3%).
| Demographics | Rating | Rank | Vision Disability |
| Cajuns | 0.0 /100 | #333 | Tragic 3.1% |
| Cheyenne | 0.0 /100 | #334 | Tragic 3.1% |
| Navajo | 0.0 /100 | #335 | Tragic 3.1% |
| Alaskan Athabascans | 0.0 /100 | #336 | Tragic 3.1% |
| Dutch West Indians | 0.0 /100 | #337 | Tragic 3.2% |
| Chickasaw | 0.0 /100 | #338 | Tragic 3.2% |
| Tsimshian | 0.0 /100 | #339 | Tragic 3.2% |
| Creek | 0.0 /100 | #340 | Tragic 3.2% |
| Kiowa | 0.0 /100 | #341 | Tragic 3.3% |
| Choctaw | 0.0 /100 | #342 | Tragic 3.3% |
| Pima | 0.0 /100 | #343 | Tragic 3.3% |
| Pueblo | 0.0 /100 | #344 | Tragic 3.3% |
| Lumbee | 0.0 /100 | #345 | Tragic 3.4% |
| Houma | 0.0 /100 | #346 | Tragic 3.4% |
| Puerto Ricans | 0.0 /100 | #347 | Tragic 3.9% |