Samoan vs Pueblo Vision Disability
COMPARE
Samoan
Pueblo
Vision Disability
Vision Disability Comparison
Samoans
Pueblo
2.2%
VISION DISABILITY
15.7/ 100
METRIC RATING
205th/ 347
METRIC RANK
3.3%
VISION DISABILITY
0.0/ 100
METRIC RATING
344th/ 347
METRIC RANK
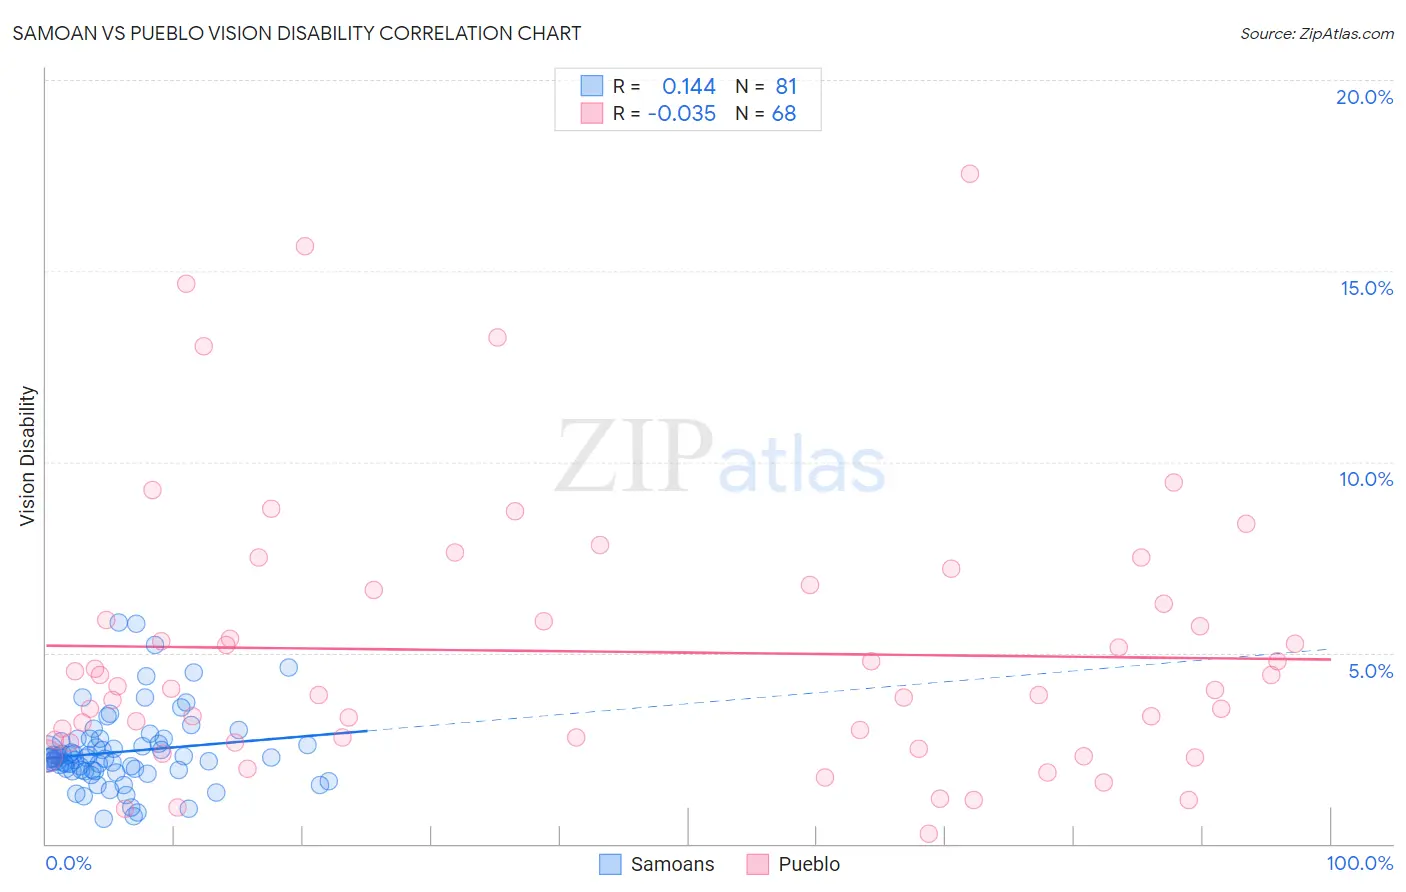
Samoan vs Pueblo Vision Disability Correlation Chart
The statistical analysis conducted on geographies consisting of 225,065,967 people shows a poor positive correlation between the proportion of Samoans and percentage of population with vision disability in the United States with a correlation coefficient (R) of 0.144 and weighted average of 2.2%. Similarly, the statistical analysis conducted on geographies consisting of 120,045,963 people shows no correlation between the proportion of Pueblo and percentage of population with vision disability in the United States with a correlation coefficient (R) of -0.035 and weighted average of 3.3%, a difference of 49.9%.
Vision Disability Correlation Summary
| Measurement | Samoan | Pueblo |
| Minimum | 0.64% | 0.28% |
| Maximum | 5.8% | 17.5% |
| Range | 5.1% | 17.3% |
| Mean | 2.4% | 5.0% |
| Median | 2.2% | 4.0% |
| Interquartile 25% (IQ1) | 1.9% | 2.7% |
| Interquartile 75% (IQ3) | 2.7% | 6.5% |
| Interquartile Range (IQR) | 0.80% | 3.8% |
| Standard Deviation (Sample) | 1.0% | 3.6% |
| Standard Deviation (Population) | 1.00% | 3.5% |
Similar Demographics by Vision Disability
Demographics Similar to Samoans by Vision Disability
In terms of vision disability, the demographic groups most similar to Samoans are Immigrants from Guyana (2.2%, a difference of 0.030%), Pennsylvania German (2.2%, a difference of 0.14%), Dutch (2.2%, a difference of 0.16%), Immigrants from Zaire (2.2%, a difference of 0.25%), and Immigrants from Nigeria (2.2%, a difference of 0.27%).
| Demographics | Rating | Rank | Vision Disability |
| Czechoslovakians | 21.6 /100 | #198 | Fair 2.2% |
| Immigrants | El Salvador | 21.0 /100 | #199 | Fair 2.2% |
| Immigrants | Thailand | 20.1 /100 | #200 | Fair 2.2% |
| Slovaks | 18.8 /100 | #201 | Poor 2.2% |
| Immigrants | Zaire | 18.0 /100 | #202 | Poor 2.2% |
| Dutch | 17.1 /100 | #203 | Poor 2.2% |
| Immigrants | Guyana | 15.9 /100 | #204 | Poor 2.2% |
| Samoans | 15.7 /100 | #205 | Poor 2.2% |
| Pennsylvania Germans | 14.5 /100 | #206 | Poor 2.2% |
| Immigrants | Nigeria | 13.5 /100 | #207 | Poor 2.2% |
| Germans | 13.4 /100 | #208 | Poor 2.2% |
| Immigrants | Brazil | 13.1 /100 | #209 | Poor 2.2% |
| Immigrants | Uruguay | 11.5 /100 | #210 | Poor 2.2% |
| Indonesians | 9.5 /100 | #211 | Tragic 2.2% |
| Bermudans | 9.0 /100 | #212 | Tragic 2.2% |
Demographics Similar to Pueblo by Vision Disability
In terms of vision disability, the demographic groups most similar to Pueblo are Pima (3.3%, a difference of 0.030%), Choctaw (3.3%, a difference of 1.1%), Lumbee (3.4%, a difference of 1.6%), Kiowa (3.3%, a difference of 2.5%), and Houma (3.4%, a difference of 3.3%).
| Demographics | Rating | Rank | Vision Disability |
| Cajuns | 0.0 /100 | #333 | Tragic 3.1% |
| Cheyenne | 0.0 /100 | #334 | Tragic 3.1% |
| Navajo | 0.0 /100 | #335 | Tragic 3.1% |
| Alaskan Athabascans | 0.0 /100 | #336 | Tragic 3.1% |
| Dutch West Indians | 0.0 /100 | #337 | Tragic 3.2% |
| Chickasaw | 0.0 /100 | #338 | Tragic 3.2% |
| Tsimshian | 0.0 /100 | #339 | Tragic 3.2% |
| Creek | 0.0 /100 | #340 | Tragic 3.2% |
| Kiowa | 0.0 /100 | #341 | Tragic 3.3% |
| Choctaw | 0.0 /100 | #342 | Tragic 3.3% |
| Pima | 0.0 /100 | #343 | Tragic 3.3% |
| Pueblo | 0.0 /100 | #344 | Tragic 3.3% |
| Lumbee | 0.0 /100 | #345 | Tragic 3.4% |
| Houma | 0.0 /100 | #346 | Tragic 3.4% |
| Puerto Ricans | 0.0 /100 | #347 | Tragic 3.9% |