Immigrants from Guyana vs Pueblo Vision Disability
COMPARE
Immigrants from Guyana
Pueblo
Vision Disability
Vision Disability Comparison
Immigrants from Guyana
Pueblo
2.2%
VISION DISABILITY
15.9/ 100
METRIC RATING
204th/ 347
METRIC RANK
3.3%
VISION DISABILITY
0.0/ 100
METRIC RATING
344th/ 347
METRIC RANK
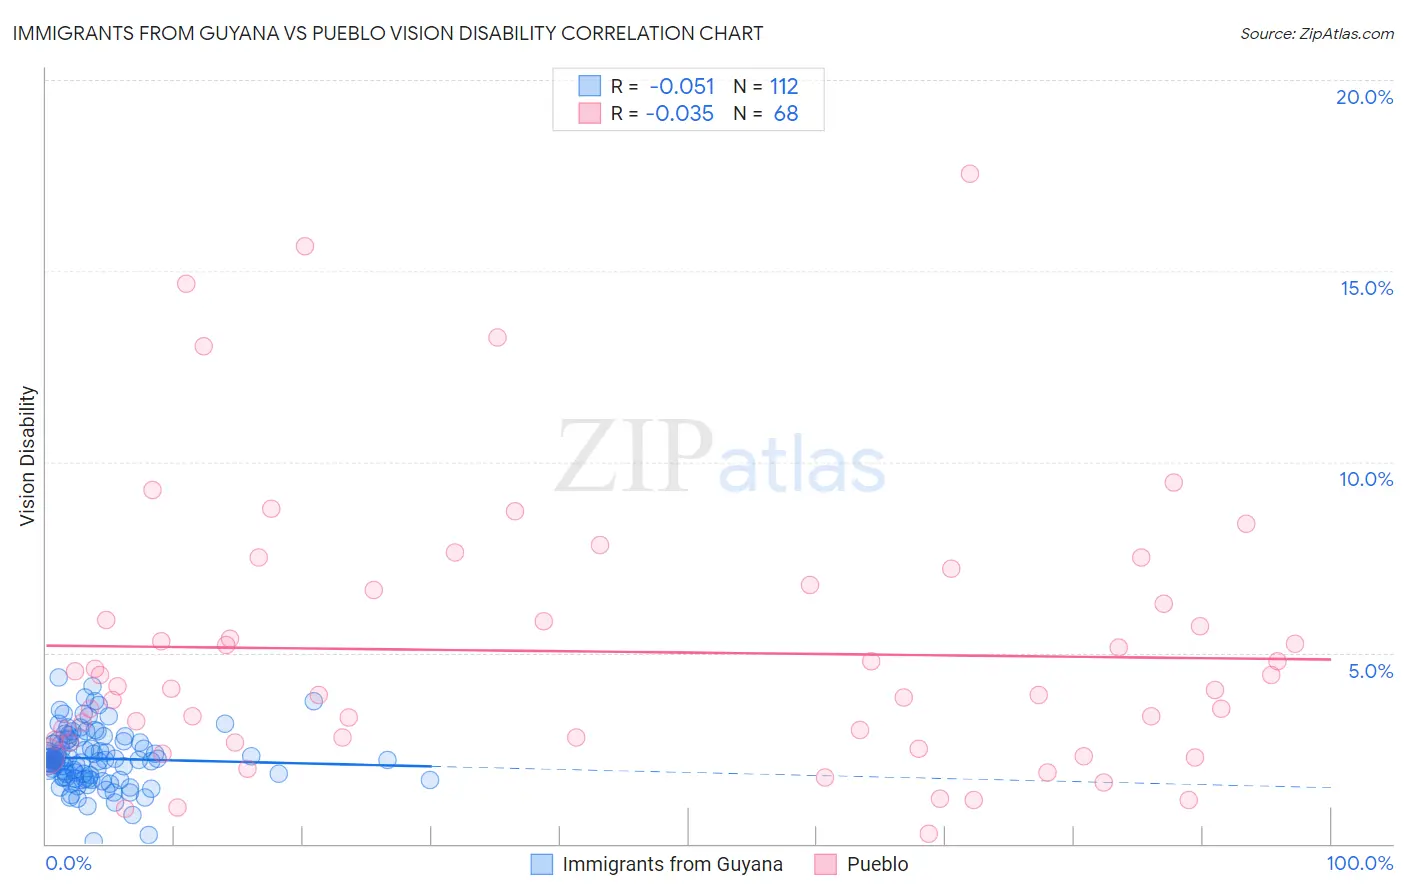
Immigrants from Guyana vs Pueblo Vision Disability Correlation Chart
The statistical analysis conducted on geographies consisting of 183,609,151 people shows a slight negative correlation between the proportion of Immigrants from Guyana and percentage of population with vision disability in the United States with a correlation coefficient (R) of -0.051 and weighted average of 2.2%. Similarly, the statistical analysis conducted on geographies consisting of 120,045,963 people shows no correlation between the proportion of Pueblo and percentage of population with vision disability in the United States with a correlation coefficient (R) of -0.035 and weighted average of 3.3%, a difference of 49.9%.
Vision Disability Correlation Summary
| Measurement | Immigrants from Guyana | Pueblo |
| Minimum | 0.051% | 0.28% |
| Maximum | 4.4% | 17.5% |
| Range | 4.3% | 17.3% |
| Mean | 2.2% | 5.0% |
| Median | 2.2% | 4.0% |
| Interquartile 25% (IQ1) | 1.7% | 2.7% |
| Interquartile 75% (IQ3) | 2.7% | 6.5% |
| Interquartile Range (IQR) | 0.95% | 3.8% |
| Standard Deviation (Sample) | 0.74% | 3.6% |
| Standard Deviation (Population) | 0.74% | 3.5% |
Similar Demographics by Vision Disability
Demographics Similar to Immigrants from Guyana by Vision Disability
In terms of vision disability, the demographic groups most similar to Immigrants from Guyana are Samoan (2.2%, a difference of 0.030%), Dutch (2.2%, a difference of 0.13%), Pennsylvania German (2.2%, a difference of 0.17%), Immigrants from Zaire (2.2%, a difference of 0.23%), and Immigrants from Nigeria (2.2%, a difference of 0.30%).
| Demographics | Rating | Rank | Vision Disability |
| Ghanaians | 21.8 /100 | #197 | Fair 2.2% |
| Czechoslovakians | 21.6 /100 | #198 | Fair 2.2% |
| Immigrants | El Salvador | 21.0 /100 | #199 | Fair 2.2% |
| Immigrants | Thailand | 20.1 /100 | #200 | Fair 2.2% |
| Slovaks | 18.8 /100 | #201 | Poor 2.2% |
| Immigrants | Zaire | 18.0 /100 | #202 | Poor 2.2% |
| Dutch | 17.1 /100 | #203 | Poor 2.2% |
| Immigrants | Guyana | 15.9 /100 | #204 | Poor 2.2% |
| Samoans | 15.7 /100 | #205 | Poor 2.2% |
| Pennsylvania Germans | 14.5 /100 | #206 | Poor 2.2% |
| Immigrants | Nigeria | 13.5 /100 | #207 | Poor 2.2% |
| Germans | 13.4 /100 | #208 | Poor 2.2% |
| Immigrants | Brazil | 13.1 /100 | #209 | Poor 2.2% |
| Immigrants | Uruguay | 11.5 /100 | #210 | Poor 2.2% |
| Indonesians | 9.5 /100 | #211 | Tragic 2.2% |
Demographics Similar to Pueblo by Vision Disability
In terms of vision disability, the demographic groups most similar to Pueblo are Pima (3.3%, a difference of 0.030%), Choctaw (3.3%, a difference of 1.1%), Lumbee (3.4%, a difference of 1.6%), Kiowa (3.3%, a difference of 2.5%), and Houma (3.4%, a difference of 3.3%).
| Demographics | Rating | Rank | Vision Disability |
| Cajuns | 0.0 /100 | #333 | Tragic 3.1% |
| Cheyenne | 0.0 /100 | #334 | Tragic 3.1% |
| Navajo | 0.0 /100 | #335 | Tragic 3.1% |
| Alaskan Athabascans | 0.0 /100 | #336 | Tragic 3.1% |
| Dutch West Indians | 0.0 /100 | #337 | Tragic 3.2% |
| Chickasaw | 0.0 /100 | #338 | Tragic 3.2% |
| Tsimshian | 0.0 /100 | #339 | Tragic 3.2% |
| Creek | 0.0 /100 | #340 | Tragic 3.2% |
| Kiowa | 0.0 /100 | #341 | Tragic 3.3% |
| Choctaw | 0.0 /100 | #342 | Tragic 3.3% |
| Pima | 0.0 /100 | #343 | Tragic 3.3% |
| Pueblo | 0.0 /100 | #344 | Tragic 3.3% |
| Lumbee | 0.0 /100 | #345 | Tragic 3.4% |
| Houma | 0.0 /100 | #346 | Tragic 3.4% |
| Puerto Ricans | 0.0 /100 | #347 | Tragic 3.9% |