Immigrants from Netherlands vs Turkish Disability Age Under 5
COMPARE
Immigrants from Netherlands
Turkish
Disability Age Under 5
Disability Age Under 5 Comparison
Immigrants from Netherlands
Turks
1.4%
DISABILITY AGE UNDER 5
0.2/ 100
METRIC RATING
261st/ 347
METRIC RANK
1.1%
DISABILITY AGE UNDER 5
98.0/ 100
METRIC RATING
81st/ 347
METRIC RANK
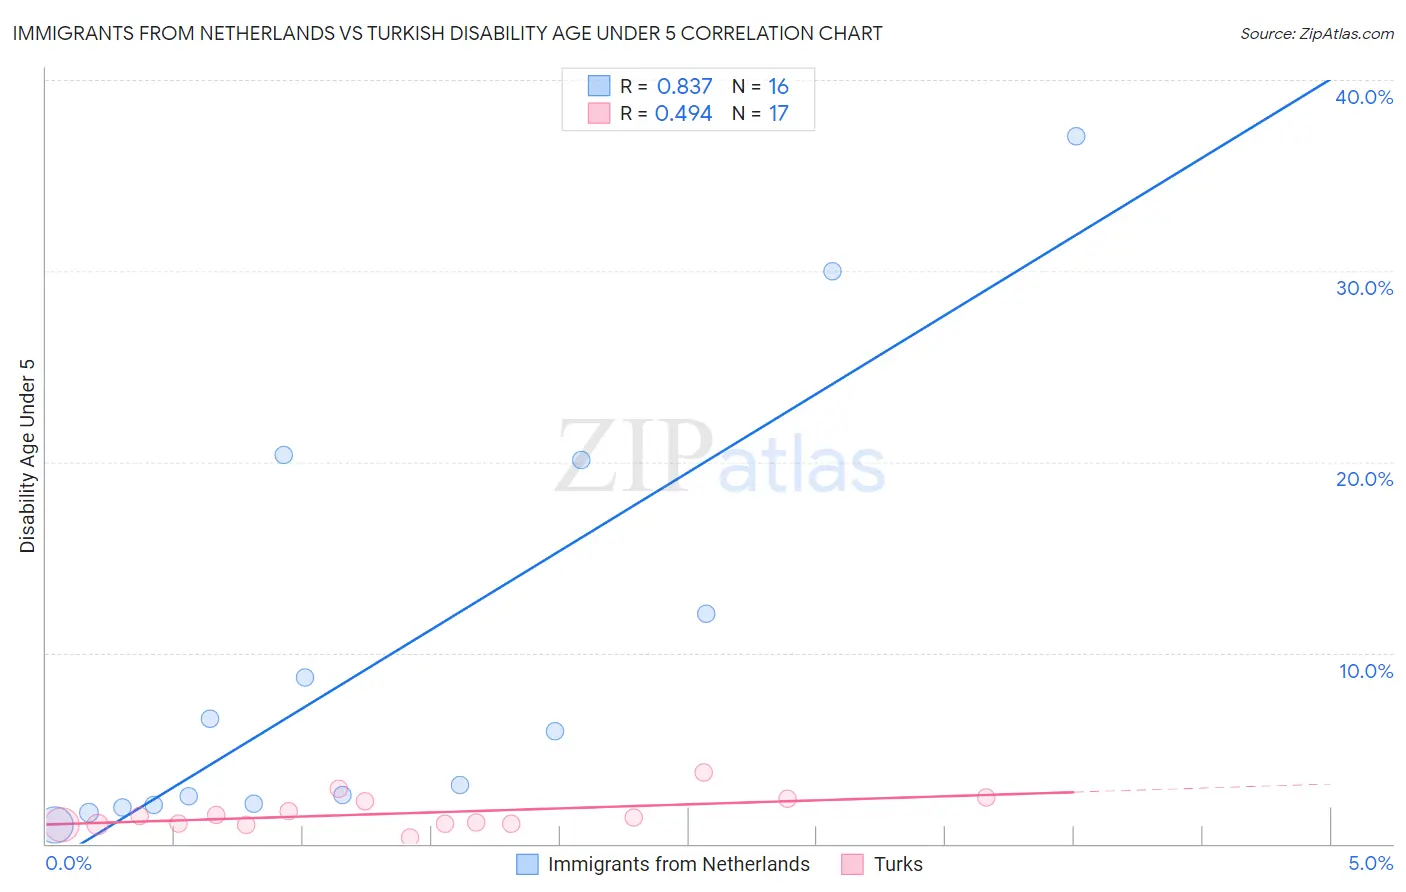
Immigrants from Netherlands vs Turkish Disability Age Under 5 Correlation Chart
The statistical analysis conducted on geographies consisting of 148,496,878 people shows a very strong positive correlation between the proportion of Immigrants from Netherlands and percentage of population with a disability under the age of 5 in the United States with a correlation coefficient (R) of 0.837 and weighted average of 1.4%. Similarly, the statistical analysis conducted on geographies consisting of 161,432,303 people shows a moderate positive correlation between the proportion of Turks and percentage of population with a disability under the age of 5 in the United States with a correlation coefficient (R) of 0.494 and weighted average of 1.1%, a difference of 25.3%.
Disability Age Under 5 Correlation Summary
| Measurement | Immigrants from Netherlands | Turkish |
| Minimum | 0.96% | 0.31% |
| Maximum | 37.0% | 3.7% |
| Range | 36.1% | 3.4% |
| Mean | 9.8% | 1.6% |
| Median | 4.5% | 1.4% |
| Interquartile 25% (IQ1) | 2.1% | 1.0% |
| Interquartile 75% (IQ3) | 16.1% | 2.3% |
| Interquartile Range (IQR) | 14.0% | 1.2% |
| Standard Deviation (Sample) | 11.2% | 0.86% |
| Standard Deviation (Population) | 10.8% | 0.83% |
Similar Demographics by Disability Age Under 5
Demographics Similar to Immigrants from Netherlands by Disability Age Under 5
In terms of disability age under 5, the demographic groups most similar to Immigrants from Netherlands are Immigrants from Dominica (1.4%, a difference of 0.16%), Spanish (1.4%, a difference of 0.22%), Yugoslavian (1.4%, a difference of 0.37%), Carpatho Rusyn (1.4%, a difference of 0.41%), and Immigrants from Germany (1.4%, a difference of 0.44%).
| Demographics | Rating | Rank | Disability Age Under 5 |
| Immigrants | Brazil | 0.7 /100 | #254 | Tragic 1.4% |
| Immigrants | Liberia | 0.6 /100 | #255 | Tragic 1.4% |
| Immigrants | Western Europe | 0.5 /100 | #256 | Tragic 1.4% |
| Slovenes | 0.3 /100 | #257 | Tragic 1.4% |
| Costa Ricans | 0.3 /100 | #258 | Tragic 1.4% |
| Immigrants | Southern Europe | 0.3 /100 | #259 | Tragic 1.4% |
| Slavs | 0.3 /100 | #260 | Tragic 1.4% |
| Immigrants | Netherlands | 0.2 /100 | #261 | Tragic 1.4% |
| Immigrants | Dominica | 0.2 /100 | #262 | Tragic 1.4% |
| Spanish | 0.2 /100 | #263 | Tragic 1.4% |
| Yugoslavians | 0.1 /100 | #264 | Tragic 1.4% |
| Carpatho Rusyns | 0.1 /100 | #265 | Tragic 1.4% |
| Immigrants | Germany | 0.1 /100 | #266 | Tragic 1.4% |
| Cree | 0.1 /100 | #267 | Tragic 1.4% |
| Belgians | 0.1 /100 | #268 | Tragic 1.4% |
Demographics Similar to Turks by Disability Age Under 5
In terms of disability age under 5, the demographic groups most similar to Turks are Immigrants from Trinidad and Tobago (1.1%, a difference of 0.020%), Hmong (1.1%, a difference of 0.040%), West Indian (1.1%, a difference of 0.060%), Immigrants from Jordan (1.1%, a difference of 0.11%), and Immigrants from Syria (1.1%, a difference of 0.12%).
| Demographics | Rating | Rank | Disability Age Under 5 |
| Jordanians | 98.5 /100 | #74 | Exceptional 1.1% |
| Immigrants | Pakistan | 98.4 /100 | #75 | Exceptional 1.1% |
| Immigrants | Burma/Myanmar | 98.2 /100 | #76 | Exceptional 1.1% |
| Immigrants | Denmark | 98.1 /100 | #77 | Exceptional 1.1% |
| West Indians | 98.0 /100 | #78 | Exceptional 1.1% |
| Hmong | 98.0 /100 | #79 | Exceptional 1.1% |
| Immigrants | Trinidad and Tobago | 98.0 /100 | #80 | Exceptional 1.1% |
| Turks | 98.0 /100 | #81 | Exceptional 1.1% |
| Immigrants | Jordan | 97.9 /100 | #82 | Exceptional 1.1% |
| Immigrants | Syria | 97.9 /100 | #83 | Exceptional 1.1% |
| Immigrants | Zaire | 97.8 /100 | #84 | Exceptional 1.1% |
| Sudanese | 97.7 /100 | #85 | Exceptional 1.1% |
| Okinawans | 97.6 /100 | #86 | Exceptional 1.1% |
| Ugandans | 97.5 /100 | #87 | Exceptional 1.1% |
| Immigrants | Dominican Republic | 97.5 /100 | #88 | Exceptional 1.1% |