Immigrants from Afghanistan vs Immigrants from Trinidad and Tobago Disability Age Over 75
COMPARE
Immigrants from Afghanistan
Immigrants from Trinidad and Tobago
Disability Age Over 75
Disability Age Over 75 Comparison
Immigrants from Afghanistan
Immigrants from Trinidad and Tobago
48.8%
DISABILITY AGE OVER 75
0.4/ 100
METRIC RATING
260th/ 347
METRIC RANK
47.6%
DISABILITY AGE OVER 75
25.3/ 100
METRIC RATING
195th/ 347
METRIC RANK
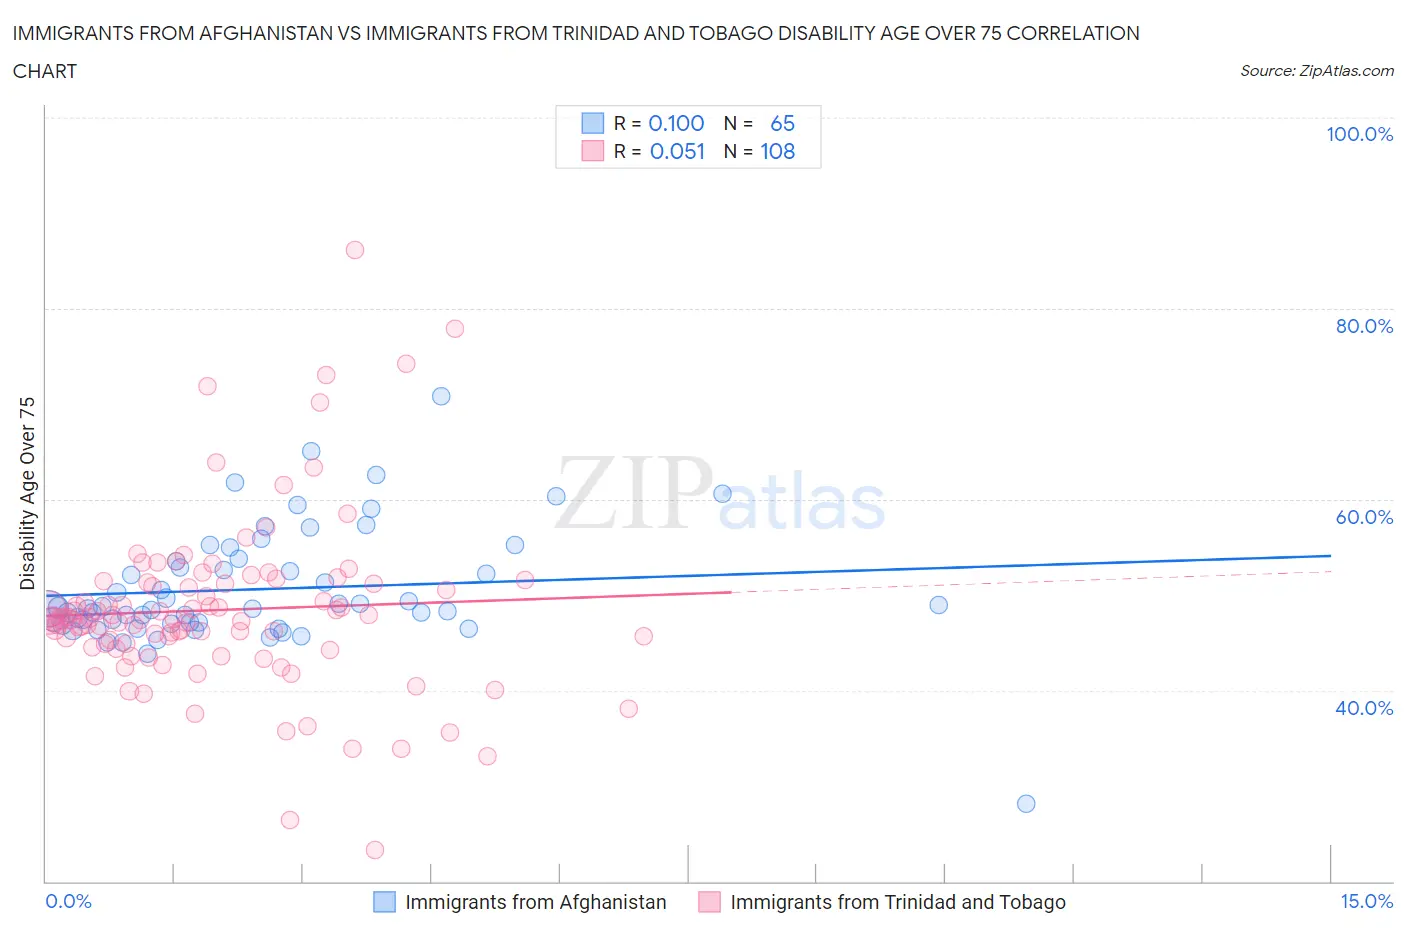
Immigrants from Afghanistan vs Immigrants from Trinidad and Tobago Disability Age Over 75 Correlation Chart
The statistical analysis conducted on geographies consisting of 147,547,224 people shows a poor positive correlation between the proportion of Immigrants from Afghanistan and percentage of population with a disability over the age of 75 in the United States with a correlation coefficient (R) of 0.100 and weighted average of 48.8%. Similarly, the statistical analysis conducted on geographies consisting of 223,345,670 people shows a slight positive correlation between the proportion of Immigrants from Trinidad and Tobago and percentage of population with a disability over the age of 75 in the United States with a correlation coefficient (R) of 0.051 and weighted average of 47.6%, a difference of 2.5%.
Disability Age Over 75 Correlation Summary
| Measurement | Immigrants from Afghanistan | Immigrants from Trinidad and Tobago |
| Minimum | 28.2% | 23.3% |
| Maximum | 70.8% | 86.1% |
| Range | 42.6% | 62.8% |
| Mean | 50.6% | 48.4% |
| Median | 48.6% | 47.4% |
| Interquartile 25% (IQ1) | 47.1% | 44.7% |
| Interquartile 75% (IQ3) | 53.7% | 51.2% |
| Interquartile Range (IQR) | 6.6% | 6.6% |
| Standard Deviation (Sample) | 6.2% | 9.2% |
| Standard Deviation (Population) | 6.2% | 9.1% |
Similar Demographics by Disability Age Over 75
Demographics Similar to Immigrants from Afghanistan by Disability Age Over 75
In terms of disability age over 75, the demographic groups most similar to Immigrants from Afghanistan are Central American (48.8%, a difference of 0.040%), African (48.9%, a difference of 0.060%), Immigrants from Philippines (48.8%, a difference of 0.11%), Immigrants from West Indies (48.9%, a difference of 0.12%), and Salvadoran (48.9%, a difference of 0.13%).
| Demographics | Rating | Rank | Disability Age Over 75 |
| British West Indians | 0.6 /100 | #253 | Tragic 48.7% |
| Immigrants | Vietnam | 0.6 /100 | #254 | Tragic 48.7% |
| Chinese | 0.5 /100 | #255 | Tragic 48.7% |
| Immigrants | Congo | 0.5 /100 | #256 | Tragic 48.7% |
| Blackfeet | 0.5 /100 | #257 | Tragic 48.8% |
| Immigrants | Philippines | 0.4 /100 | #258 | Tragic 48.8% |
| Central Americans | 0.4 /100 | #259 | Tragic 48.8% |
| Immigrants | Afghanistan | 0.4 /100 | #260 | Tragic 48.8% |
| Africans | 0.3 /100 | #261 | Tragic 48.9% |
| Immigrants | West Indies | 0.3 /100 | #262 | Tragic 48.9% |
| Salvadorans | 0.3 /100 | #263 | Tragic 48.9% |
| Immigrants | Honduras | 0.3 /100 | #264 | Tragic 48.9% |
| Hondurans | 0.3 /100 | #265 | Tragic 48.9% |
| U.S. Virgin Islanders | 0.2 /100 | #266 | Tragic 48.9% |
| Malaysians | 0.2 /100 | #267 | Tragic 49.0% |
Demographics Similar to Immigrants from Trinidad and Tobago by Disability Age Over 75
In terms of disability age over 75, the demographic groups most similar to Immigrants from Trinidad and Tobago are Immigrants from Lebanon (47.6%, a difference of 0.030%), Immigrants from Portugal (47.6%, a difference of 0.050%), Pakistani (47.7%, a difference of 0.060%), Immigrants from Ukraine (47.7%, a difference of 0.060%), and Immigrants from Jamaica (47.6%, a difference of 0.080%).
| Demographics | Rating | Rank | Disability Age Over 75 |
| Basques | 30.9 /100 | #188 | Fair 47.6% |
| Immigrants | Kenya | 30.8 /100 | #189 | Fair 47.6% |
| Somalis | 29.5 /100 | #190 | Fair 47.6% |
| Portuguese | 29.3 /100 | #191 | Fair 47.6% |
| Immigrants | Jamaica | 28.3 /100 | #192 | Fair 47.6% |
| Ottawa | 28.1 /100 | #193 | Fair 47.6% |
| Immigrants | Lebanon | 26.5 /100 | #194 | Fair 47.6% |
| Immigrants | Trinidad and Tobago | 25.3 /100 | #195 | Fair 47.6% |
| Immigrants | Portugal | 23.8 /100 | #196 | Fair 47.6% |
| Pakistanis | 23.4 /100 | #197 | Fair 47.7% |
| Immigrants | Ukraine | 23.2 /100 | #198 | Fair 47.7% |
| Immigrants | Eritrea | 22.4 /100 | #199 | Fair 47.7% |
| Immigrants | Somalia | 21.4 /100 | #200 | Fair 47.7% |
| Immigrants | Cuba | 20.9 /100 | #201 | Fair 47.7% |
| Immigrants | Bahamas | 20.7 /100 | #202 | Fair 47.7% |