Immigrants from Germany vs Immigrants from Africa Married-couple Households
COMPARE
Immigrants from Germany
Immigrants from Africa
Married-couple Households
Married-couple Households Comparison
Immigrants from Germany
Immigrants from Africa
47.5%
MARRIED-COUPLE HOUSEHOLDS
92.4/ 100
METRIC RATING
118th/ 347
METRIC RANK
42.9%
MARRIED-COUPLE HOUSEHOLDS
0.0/ 100
METRIC RATING
278th/ 347
METRIC RANK
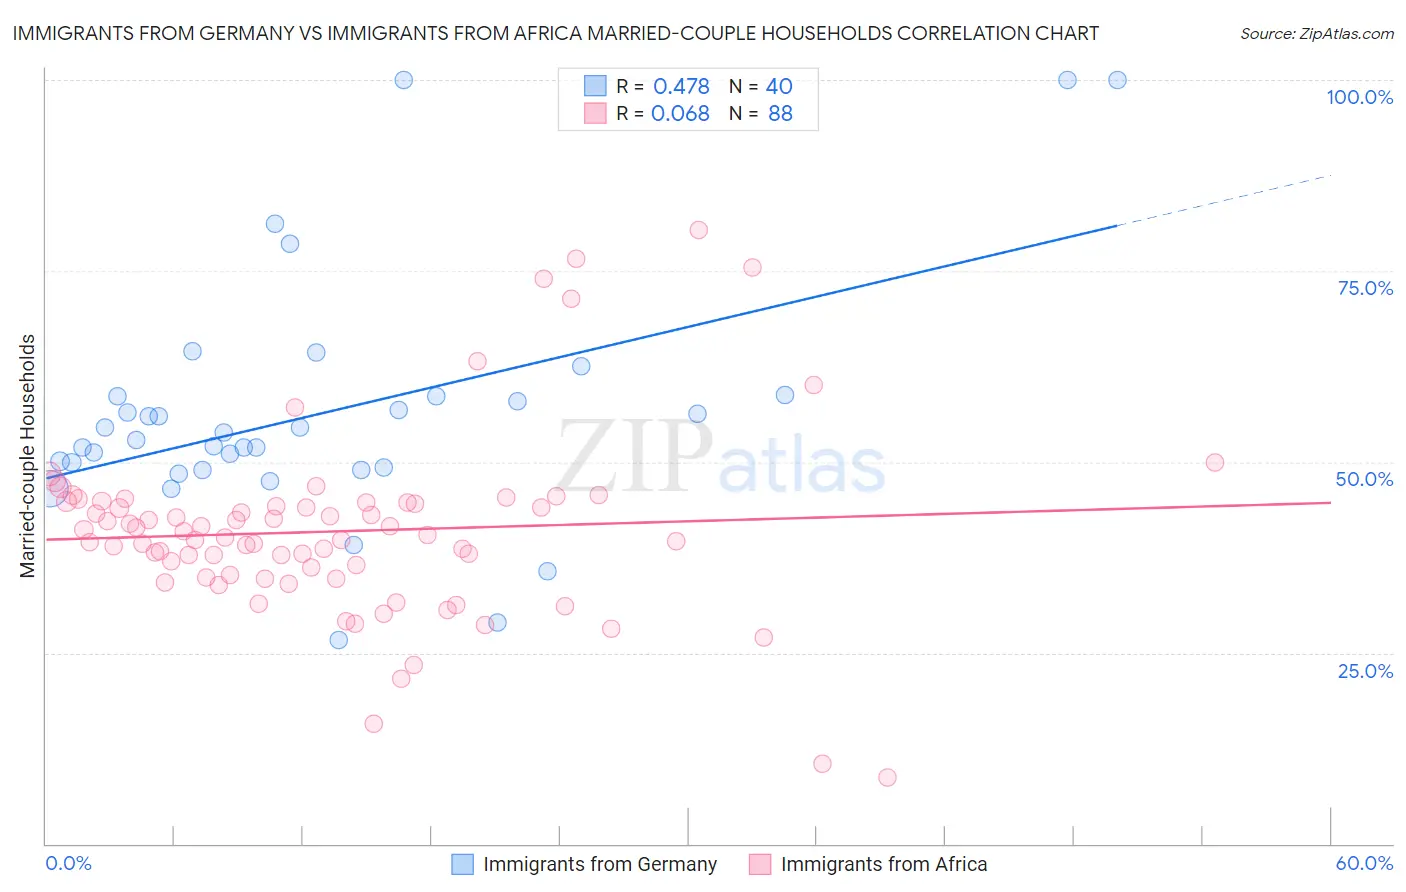
Immigrants from Germany vs Immigrants from Africa Married-couple Households Correlation Chart
The statistical analysis conducted on geographies consisting of 463,743,898 people shows a moderate positive correlation between the proportion of Immigrants from Germany and percentage of married-couple family households in the United States with a correlation coefficient (R) of 0.478 and weighted average of 47.5%. Similarly, the statistical analysis conducted on geographies consisting of 468,925,641 people shows a slight positive correlation between the proportion of Immigrants from Africa and percentage of married-couple family households in the United States with a correlation coefficient (R) of 0.068 and weighted average of 42.9%, a difference of 10.8%.
Married-couple Households Correlation Summary
| Measurement | Immigrants from Germany | Immigrants from Africa |
| Minimum | 26.7% | 8.7% |
| Maximum | 100.0% | 80.4% |
| Range | 73.3% | 71.7% |
| Mean | 56.5% | 40.9% |
| Median | 53.4% | 40.3% |
| Interquartile 25% (IQ1) | 49.1% | 35.0% |
| Interquartile 75% (IQ3) | 58.6% | 44.7% |
| Interquartile Range (IQR) | 9.5% | 9.7% |
| Standard Deviation (Sample) | 16.1% | 12.1% |
| Standard Deviation (Population) | 15.9% | 12.1% |
Similar Demographics by Married-couple Households
Demographics Similar to Immigrants from Germany by Married-couple Households
In terms of married-couple households, the demographic groups most similar to Immigrants from Germany are French Canadian (47.5%, a difference of 0.010%), Argentinean (47.5%, a difference of 0.020%), Chilean (47.5%, a difference of 0.030%), Slovak (47.6%, a difference of 0.070%), and Immigrants from Europe (47.6%, a difference of 0.19%).
| Demographics | Rating | Rank | Married-couple Households |
| Syrians | 93.9 /100 | #111 | Exceptional 47.6% |
| Peruvians | 93.8 /100 | #112 | Exceptional 47.6% |
| Venezuelans | 93.8 /100 | #113 | Exceptional 47.6% |
| Immigrants | Europe | 93.7 /100 | #114 | Exceptional 47.6% |
| Slovaks | 92.9 /100 | #115 | Exceptional 47.6% |
| Argentineans | 92.5 /100 | #116 | Exceptional 47.5% |
| French Canadians | 92.4 /100 | #117 | Exceptional 47.5% |
| Immigrants | Germany | 92.4 /100 | #118 | Exceptional 47.5% |
| Chileans | 92.2 /100 | #119 | Exceptional 47.5% |
| Puget Sound Salish | 90.5 /100 | #120 | Exceptional 47.4% |
| Immigrants | Eastern Europe | 90.3 /100 | #121 | Exceptional 47.4% |
| Okinawans | 90.1 /100 | #122 | Exceptional 47.4% |
| Immigrants | Venezuela | 89.3 /100 | #123 | Excellent 47.4% |
| Zimbabweans | 89.2 /100 | #124 | Excellent 47.4% |
| Australians | 89.0 /100 | #125 | Excellent 47.4% |
Demographics Similar to Immigrants from Africa by Married-couple Households
In terms of married-couple households, the demographic groups most similar to Immigrants from Africa are Sierra Leonean (42.9%, a difference of 0.030%), Immigrants from Ecuador (42.9%, a difference of 0.080%), Immigrants from Eastern Africa (42.9%, a difference of 0.11%), Immigrants from Guatemala (42.8%, a difference of 0.16%), and Immigrants from Ethiopia (43.1%, a difference of 0.36%).
| Demographics | Rating | Rank | Married-couple Households |
| Guatemalans | 0.1 /100 | #271 | Tragic 43.3% |
| Immigrants | Nigeria | 0.1 /100 | #272 | Tragic 43.2% |
| Ethiopians | 0.1 /100 | #273 | Tragic 43.2% |
| Nigerians | 0.1 /100 | #274 | Tragic 43.2% |
| Immigrants | Bangladesh | 0.0 /100 | #275 | Tragic 43.1% |
| Immigrants | Ethiopia | 0.0 /100 | #276 | Tragic 43.1% |
| Immigrants | Eastern Africa | 0.0 /100 | #277 | Tragic 42.9% |
| Immigrants | Africa | 0.0 /100 | #278 | Tragic 42.9% |
| Sierra Leoneans | 0.0 /100 | #279 | Tragic 42.9% |
| Immigrants | Ecuador | 0.0 /100 | #280 | Tragic 42.9% |
| Immigrants | Guatemala | 0.0 /100 | #281 | Tragic 42.8% |
| Bermudans | 0.0 /100 | #282 | Tragic 42.4% |
| Inupiat | 0.0 /100 | #283 | Tragic 42.4% |
| Cheyenne | 0.0 /100 | #284 | Tragic 42.3% |
| Ghanaians | 0.0 /100 | #285 | Tragic 42.2% |