Immigrants from France vs Israeli Disability Age 65 to 74
COMPARE
Immigrants from France
Israeli
Disability Age 65 to 74
Disability Age 65 to 74 Comparison
Immigrants from France
Israelis
21.5%
DISABILITY AGE 65 TO 74
99.6/ 100
METRIC RATING
52nd/ 347
METRIC RANK
21.2%
DISABILITY AGE 65 TO 74
99.8/ 100
METRIC RATING
37th/ 347
METRIC RANK
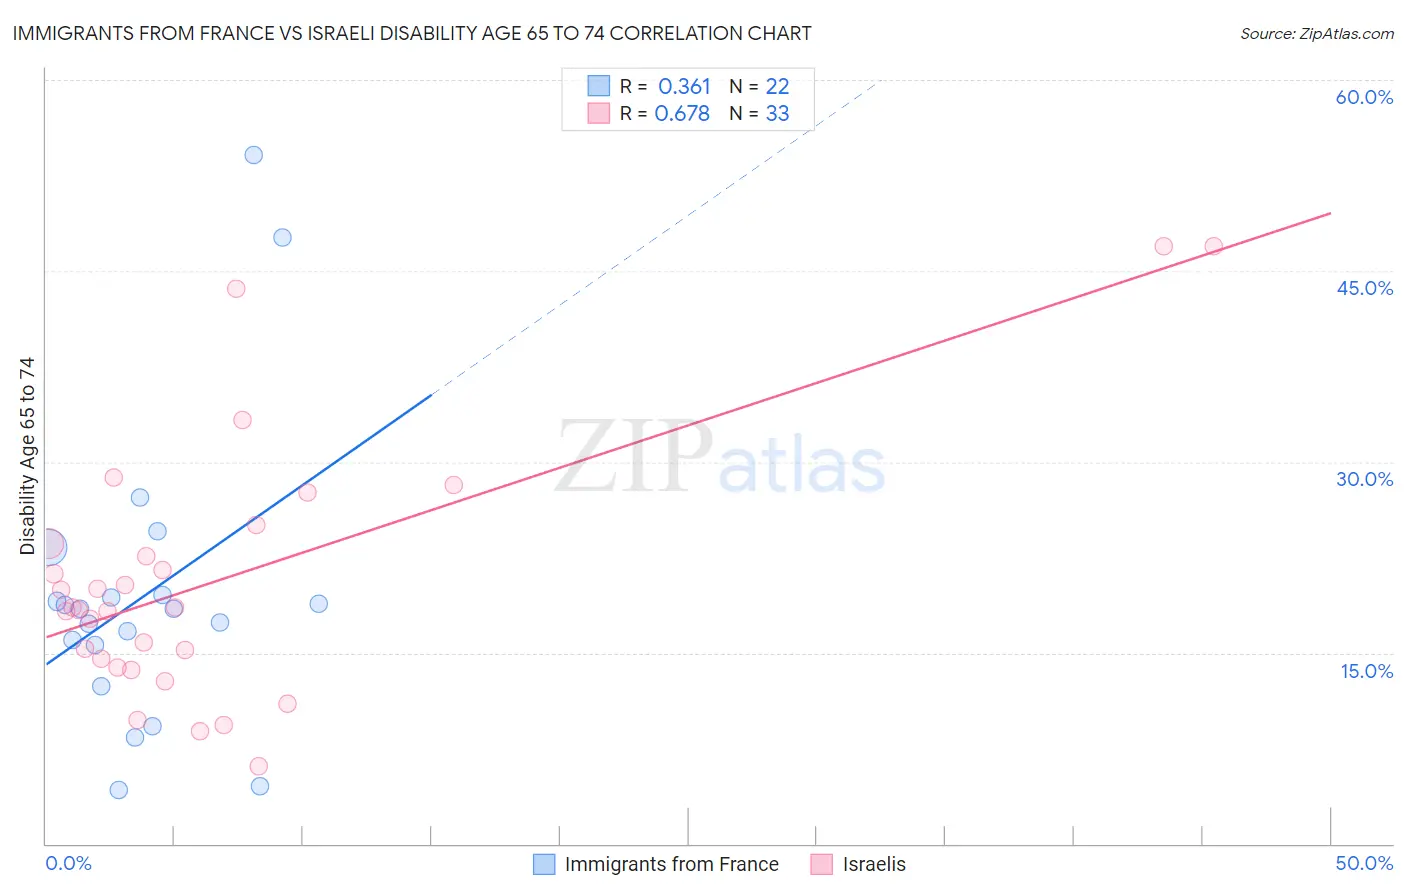
Immigrants from France vs Israeli Disability Age 65 to 74 Correlation Chart
The statistical analysis conducted on geographies consisting of 287,648,161 people shows a mild positive correlation between the proportion of Immigrants from France and percentage of population with a disability between the ages 65 and 75 in the United States with a correlation coefficient (R) of 0.361 and weighted average of 21.5%. Similarly, the statistical analysis conducted on geographies consisting of 210,778,329 people shows a significant positive correlation between the proportion of Israelis and percentage of population with a disability between the ages 65 and 75 in the United States with a correlation coefficient (R) of 0.678 and weighted average of 21.2%, a difference of 1.6%.
Disability Age 65 to 74 Correlation Summary
| Measurement | Immigrants from France | Israeli |
| Minimum | 4.3% | 6.1% |
| Maximum | 54.1% | 46.9% |
| Range | 49.8% | 40.8% |
| Mean | 19.6% | 20.8% |
| Median | 18.5% | 18.5% |
| Interquartile 25% (IQ1) | 15.6% | 14.2% |
| Interquartile 75% (IQ3) | 19.5% | 24.3% |
| Interquartile Range (IQR) | 3.9% | 10.1% |
| Standard Deviation (Sample) | 11.7% | 10.1% |
| Standard Deviation (Population) | 11.4% | 10.0% |
Demographics Similar to Immigrants from France and Israelis by Disability Age 65 to 74
In terms of disability age 65 to 74, the demographic groups most similar to Immigrants from France are Bhutanese (21.5%, a difference of 0.010%), Immigrants from Italy (21.5%, a difference of 0.020%), Immigrants from Serbia (21.4%, a difference of 0.22%), Immigrants from Malaysia (21.4%, a difference of 0.45%), and Luxembourger (21.4%, a difference of 0.47%). Similarly, the demographic groups most similar to Israelis are Russian (21.2%, a difference of 0.0%), Immigrants from Switzerland (21.1%, a difference of 0.11%), Argentinean (21.2%, a difference of 0.19%), Bulgarian (21.1%, a difference of 0.30%), and Latvian (21.2%, a difference of 0.35%).
| Demographics | Rating | Rank | Disability Age 65 to 74 |
| Immigrants | Sri Lanka | 99.9 /100 | #34 | Exceptional 21.1% |
| Bulgarians | 99.9 /100 | #35 | Exceptional 21.1% |
| Immigrants | Switzerland | 99.8 /100 | #36 | Exceptional 21.1% |
| Israelis | 99.8 /100 | #37 | Exceptional 21.2% |
| Russians | 99.8 /100 | #38 | Exceptional 21.2% |
| Argentineans | 99.8 /100 | #39 | Exceptional 21.2% |
| Latvians | 99.8 /100 | #40 | Exceptional 21.2% |
| Immigrants | Austria | 99.8 /100 | #41 | Exceptional 21.2% |
| Macedonians | 99.7 /100 | #42 | Exceptional 21.3% |
| Immigrants | Croatia | 99.7 /100 | #43 | Exceptional 21.3% |
| Estonians | 99.7 /100 | #44 | Exceptional 21.4% |
| Asians | 99.7 /100 | #45 | Exceptional 21.4% |
| Immigrants | Turkey | 99.7 /100 | #46 | Exceptional 21.4% |
| Immigrants | Bulgaria | 99.7 /100 | #47 | Exceptional 21.4% |
| Lithuanians | 99.7 /100 | #48 | Exceptional 21.4% |
| Luxembourgers | 99.7 /100 | #49 | Exceptional 21.4% |
| Immigrants | Malaysia | 99.7 /100 | #50 | Exceptional 21.4% |
| Immigrants | Serbia | 99.6 /100 | #51 | Exceptional 21.4% |
| Immigrants | France | 99.6 /100 | #52 | Exceptional 21.5% |
| Bhutanese | 99.6 /100 | #53 | Exceptional 21.5% |
| Immigrants | Italy | 99.6 /100 | #54 | Exceptional 21.5% |