Immigrants from Fiji vs Venezuelan 8th Grade
COMPARE
Immigrants from Fiji
Venezuelan
8th Grade
8th Grade Comparison
Immigrants from Fiji
Venezuelans
93.2%
8TH GRADE
0.0/ 100
METRIC RATING
320th/ 347
METRIC RANK
95.7%
8TH GRADE
47.5/ 100
METRIC RATING
178th/ 347
METRIC RANK
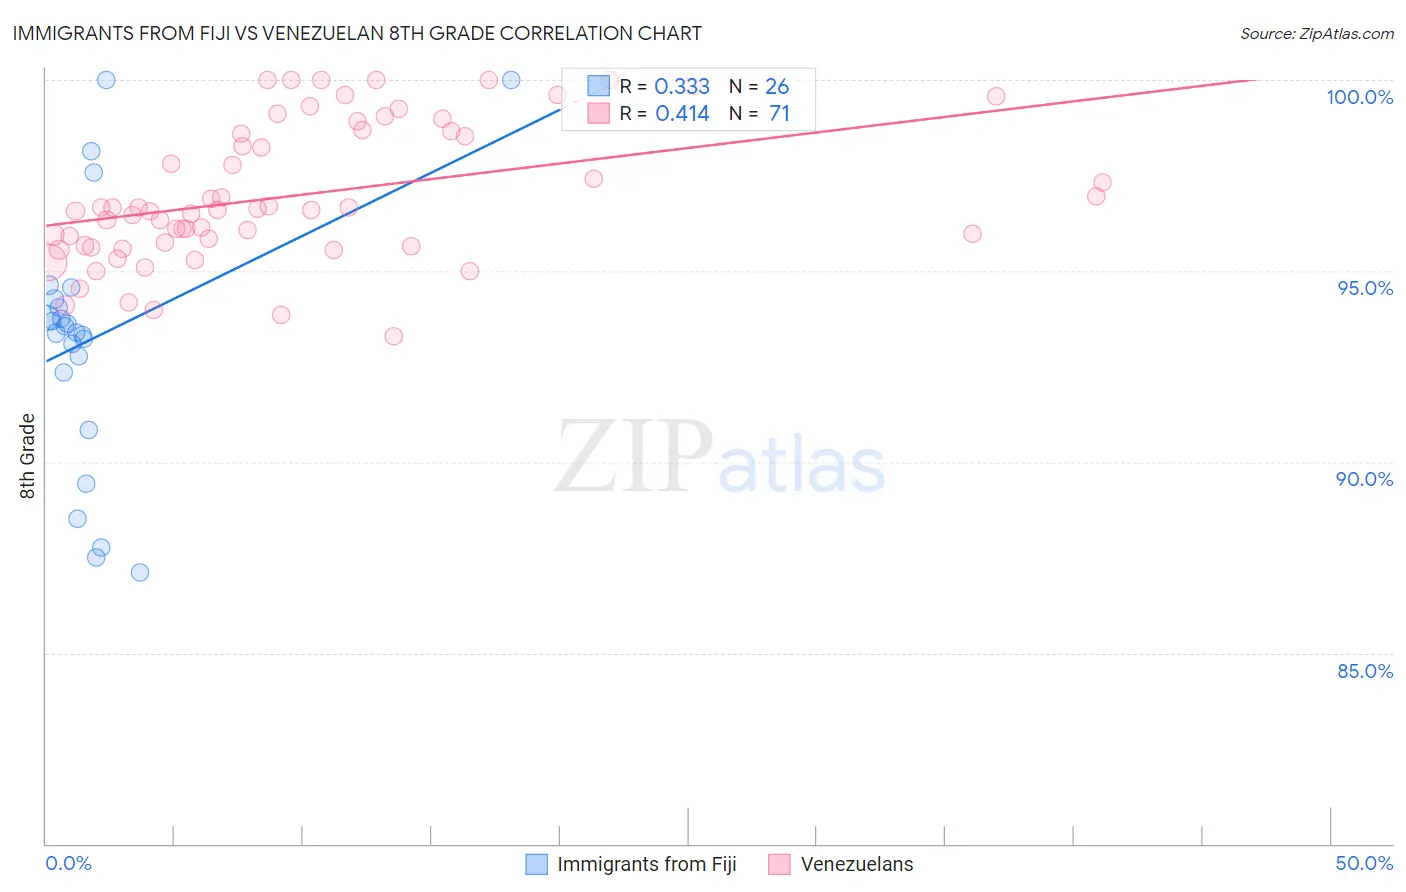
Immigrants from Fiji vs Venezuelan 8th Grade Correlation Chart
The statistical analysis conducted on geographies consisting of 93,756,204 people shows a mild positive correlation between the proportion of Immigrants from Fiji and percentage of population with at least 8th grade education in the United States with a correlation coefficient (R) of 0.333 and weighted average of 93.2%. Similarly, the statistical analysis conducted on geographies consisting of 306,323,638 people shows a moderate positive correlation between the proportion of Venezuelans and percentage of population with at least 8th grade education in the United States with a correlation coefficient (R) of 0.414 and weighted average of 95.7%, a difference of 2.7%.
8th Grade Correlation Summary
| Measurement | Immigrants from Fiji | Venezuelan |
| Minimum | 87.1% | 93.3% |
| Maximum | 100.0% | 100.0% |
| Range | 12.9% | 6.7% |
| Mean | 93.2% | 97.0% |
| Median | 93.5% | 96.6% |
| Interquartile 25% (IQ1) | 92.4% | 95.7% |
| Interquartile 75% (IQ3) | 94.3% | 98.7% |
| Interquartile Range (IQR) | 1.9% | 3.0% |
| Standard Deviation (Sample) | 3.4% | 1.8% |
| Standard Deviation (Population) | 3.3% | 1.8% |
Similar Demographics by 8th Grade
Demographics Similar to Immigrants from Fiji by 8th Grade
In terms of 8th grade, the demographic groups most similar to Immigrants from Fiji are Immigrants from Cuba (93.2%, a difference of 0.030%), Puerto Rican (93.2%, a difference of 0.060%), Immigrants from Ecuador (93.3%, a difference of 0.070%), Immigrants from Cambodia (93.3%, a difference of 0.12%), and Belizean (93.1%, a difference of 0.13%).
| Demographics | Rating | Rank | 8th Grade |
| Immigrants | Caribbean | 0.0 /100 | #313 | Tragic 93.5% |
| Immigrants | Vietnam | 0.0 /100 | #314 | Tragic 93.5% |
| Vietnamese | 0.0 /100 | #315 | Tragic 93.5% |
| Immigrants | Cambodia | 0.0 /100 | #316 | Tragic 93.3% |
| Immigrants | Ecuador | 0.0 /100 | #317 | Tragic 93.3% |
| Puerto Ricans | 0.0 /100 | #318 | Tragic 93.2% |
| Immigrants | Cuba | 0.0 /100 | #319 | Tragic 93.2% |
| Immigrants | Fiji | 0.0 /100 | #320 | Tragic 93.2% |
| Belizeans | 0.0 /100 | #321 | Tragic 93.1% |
| Nicaraguans | 0.0 /100 | #322 | Tragic 93.0% |
| Immigrants | Belize | 0.0 /100 | #323 | Tragic 92.9% |
| Nepalese | 0.0 /100 | #324 | Tragic 92.8% |
| Dominicans | 0.0 /100 | #325 | Tragic 92.8% |
| Central American Indians | 0.0 /100 | #326 | Tragic 92.7% |
| Immigrants | Azores | 0.0 /100 | #327 | Tragic 92.5% |
Demographics Similar to Venezuelans by 8th Grade
In terms of 8th grade, the demographic groups most similar to Venezuelans are Marshallese (95.7%, a difference of 0.0%), Immigrants from Albania (95.7%, a difference of 0.010%), Pakistani (95.7%, a difference of 0.010%), Immigrants from Brazil (95.7%, a difference of 0.010%), and Chilean (95.7%, a difference of 0.020%).
| Demographics | Rating | Rank | 8th Grade |
| Egyptians | 58.2 /100 | #171 | Average 95.8% |
| Immigrants | Korea | 57.9 /100 | #172 | Average 95.8% |
| Mongolians | 53.0 /100 | #173 | Average 95.8% |
| Chileans | 50.0 /100 | #174 | Average 95.7% |
| Immigrants | Albania | 49.6 /100 | #175 | Average 95.7% |
| Pakistanis | 48.8 /100 | #176 | Average 95.7% |
| Marshallese | 47.6 /100 | #177 | Average 95.7% |
| Venezuelans | 47.5 /100 | #178 | Average 95.7% |
| Immigrants | Brazil | 45.4 /100 | #179 | Average 95.7% |
| Iraqis | 40.5 /100 | #180 | Average 95.7% |
| Immigrants | Spain | 38.7 /100 | #181 | Fair 95.7% |
| Immigrants | Egypt | 37.9 /100 | #182 | Fair 95.7% |
| Immigrants | Iraq | 36.2 /100 | #183 | Fair 95.6% |
| Immigrants | Uganda | 36.0 /100 | #184 | Fair 95.6% |
| Blacks/African Americans | 34.8 /100 | #185 | Fair 95.6% |