Immigrants from Fiji vs Immigrants from Latvia Kindergarten
COMPARE
Immigrants from Fiji
Immigrants from Latvia
Kindergarten
Kindergarten Comparison
Immigrants from Fiji
Immigrants from Latvia
96.5%
KINDERGARTEN
0.0/ 100
METRIC RATING
338th/ 347
METRIC RANK
98.2%
KINDERGARTEN
96.3/ 100
METRIC RATING
113th/ 347
METRIC RANK
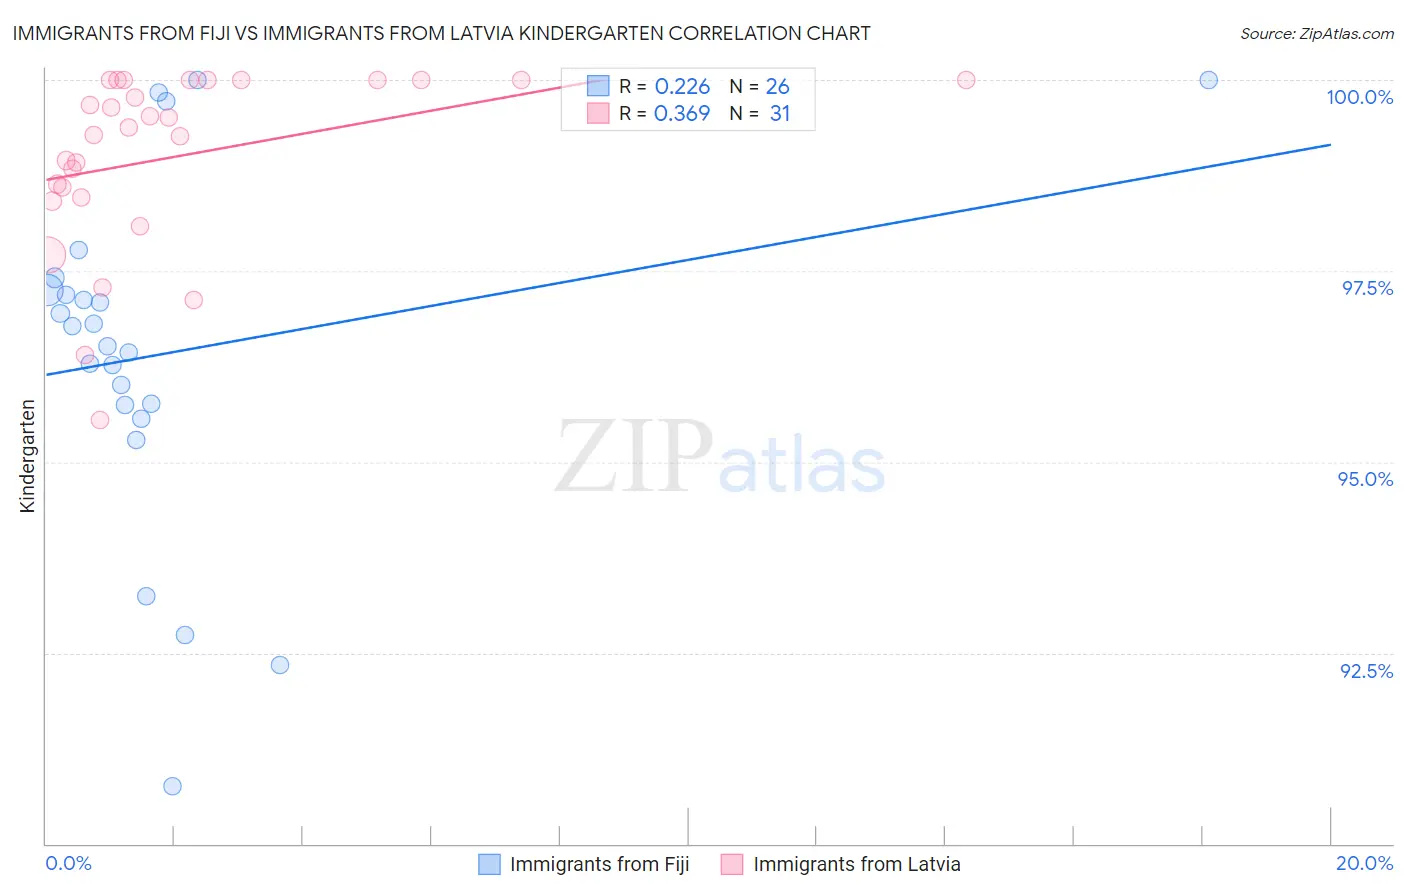
Immigrants from Fiji vs Immigrants from Latvia Kindergarten Correlation Chart
The statistical analysis conducted on geographies consisting of 93,756,204 people shows a weak positive correlation between the proportion of Immigrants from Fiji and percentage of population with at least kindergarten education in the United States with a correlation coefficient (R) of 0.226 and weighted average of 96.5%. Similarly, the statistical analysis conducted on geographies consisting of 113,735,345 people shows a mild positive correlation between the proportion of Immigrants from Latvia and percentage of population with at least kindergarten education in the United States with a correlation coefficient (R) of 0.369 and weighted average of 98.2%, a difference of 1.8%.
Kindergarten Correlation Summary
| Measurement | Immigrants from Fiji | Immigrants from Latvia |
| Minimum | 90.8% | 95.5% |
| Maximum | 100.0% | 100.0% |
| Range | 9.2% | 4.5% |
| Mean | 96.4% | 99.0% |
| Median | 96.6% | 99.4% |
| Interquartile 25% (IQ1) | 95.7% | 98.5% |
| Interquartile 75% (IQ3) | 97.2% | 100.0% |
| Interquartile Range (IQR) | 1.5% | 1.5% |
| Standard Deviation (Sample) | 2.3% | 1.2% |
| Standard Deviation (Population) | 2.2% | 1.1% |
Similar Demographics by Kindergarten
Demographics Similar to Immigrants from Fiji by Kindergarten
In terms of kindergarten, the demographic groups most similar to Immigrants from Fiji are Immigrants from Cambodia (96.5%, a difference of 0.010%), Guatemalan (96.5%, a difference of 0.050%), Immigrants from Dominican Republic (96.6%, a difference of 0.080%), Bangladeshi (96.6%, a difference of 0.080%), and Immigrants from Guatemala (96.4%, a difference of 0.080%).
| Demographics | Rating | Rank | Kindergarten |
| Immigrants | Armenia | 0.0 /100 | #331 | Tragic 96.6% |
| Yakama | 0.0 /100 | #332 | Tragic 96.6% |
| Central Americans | 0.0 /100 | #333 | Tragic 96.6% |
| Immigrants | Dominican Republic | 0.0 /100 | #334 | Tragic 96.6% |
| Bangladeshis | 0.0 /100 | #335 | Tragic 96.6% |
| Guatemalans | 0.0 /100 | #336 | Tragic 96.5% |
| Immigrants | Cambodia | 0.0 /100 | #337 | Tragic 96.5% |
| Immigrants | Fiji | 0.0 /100 | #338 | Tragic 96.5% |
| Immigrants | Guatemala | 0.0 /100 | #339 | Tragic 96.4% |
| Immigrants | Central America | 0.0 /100 | #340 | Tragic 96.4% |
| Immigrants | Cabo Verde | 0.0 /100 | #341 | Tragic 96.4% |
| Immigrants | Mexico | 0.0 /100 | #342 | Tragic 96.4% |
| Salvadorans | 0.0 /100 | #343 | Tragic 96.3% |
| Nepalese | 0.0 /100 | #344 | Tragic 96.2% |
| Immigrants | El Salvador | 0.0 /100 | #345 | Tragic 96.2% |
Demographics Similar to Immigrants from Latvia by Kindergarten
In terms of kindergarten, the demographic groups most similar to Immigrants from Latvia are Ute (98.2%, a difference of 0.0%), Iranian (98.2%, a difference of 0.0%), Immigrants from Singapore (98.2%, a difference of 0.010%), Immigrants from Norway (98.2%, a difference of 0.010%), and Immigrants from Czechoslovakia (98.2%, a difference of 0.010%).
| Demographics | Rating | Rank | Kindergarten |
| Basques | 97.3 /100 | #106 | Exceptional 98.2% |
| Turks | 97.3 /100 | #107 | Exceptional 98.2% |
| Immigrants | Switzerland | 97.2 /100 | #108 | Exceptional 98.2% |
| German Russians | 97.1 /100 | #109 | Exceptional 98.2% |
| Immigrants | Singapore | 96.8 /100 | #110 | Exceptional 98.2% |
| Immigrants | Norway | 96.6 /100 | #111 | Exceptional 98.2% |
| Immigrants | Czechoslovakia | 96.6 /100 | #112 | Exceptional 98.2% |
| Immigrants | Latvia | 96.3 /100 | #113 | Exceptional 98.2% |
| Ute | 96.3 /100 | #114 | Exceptional 98.2% |
| Iranians | 96.2 /100 | #115 | Exceptional 98.2% |
| Spanish | 95.8 /100 | #116 | Exceptional 98.2% |
| Immigrants | France | 95.5 /100 | #117 | Exceptional 98.2% |
| Yugoslavians | 95.5 /100 | #118 | Exceptional 98.2% |
| Thais | 94.8 /100 | #119 | Exceptional 98.2% |
| Okinawans | 94.4 /100 | #120 | Exceptional 98.2% |