Immigrants from Europe vs South African 8th Grade
COMPARE
Immigrants from Europe
South African
8th Grade
8th Grade Comparison
Immigrants from Europe
South Africans
96.2%
8TH GRADE
95.3/ 100
METRIC RATING
122nd/ 347
METRIC RANK
96.4%
8TH GRADE
98.2/ 100
METRIC RATING
102nd/ 347
METRIC RANK
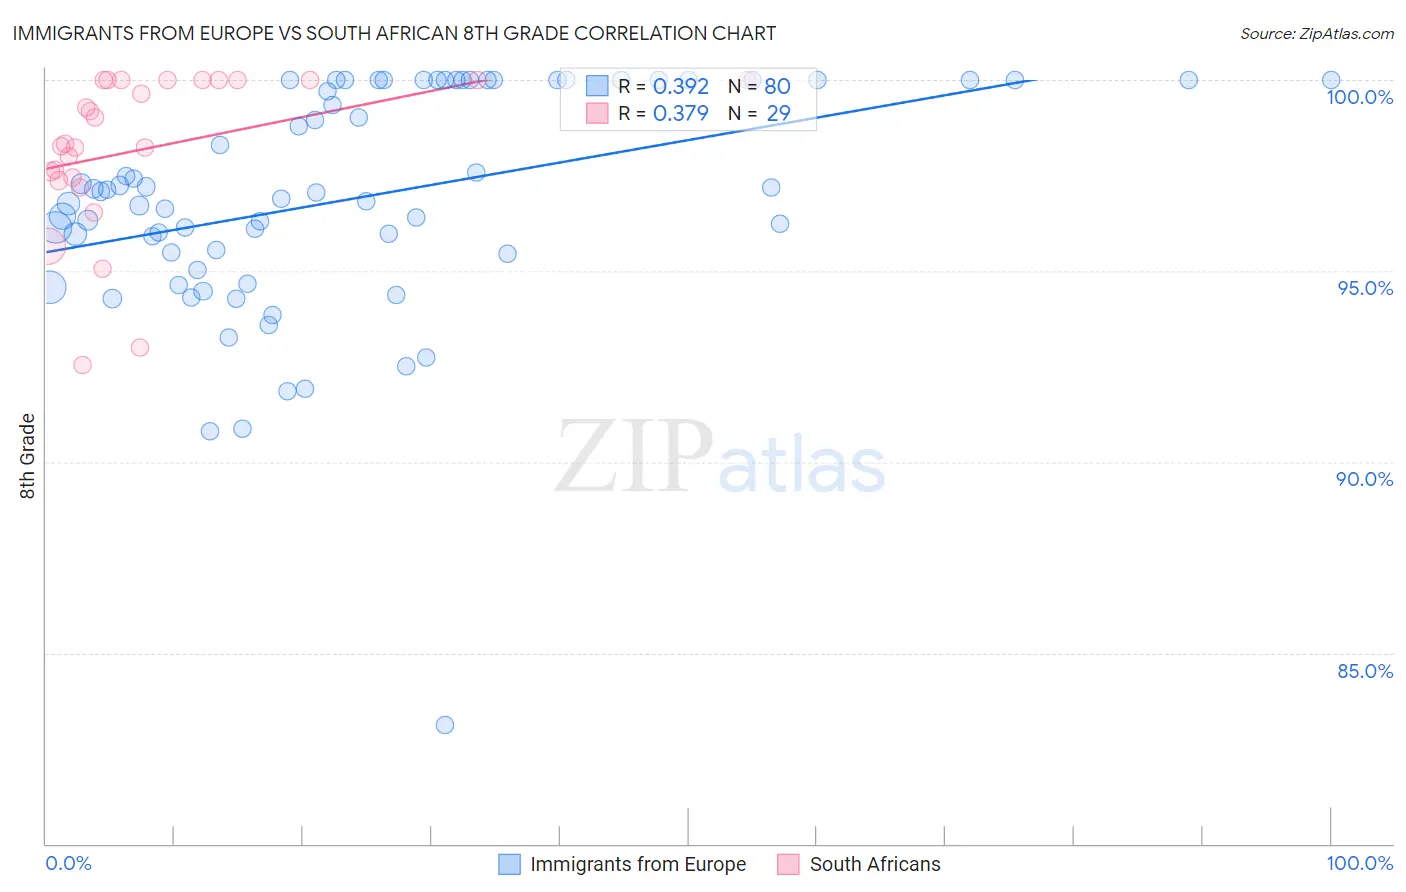
Immigrants from Europe vs South African 8th Grade Correlation Chart
The statistical analysis conducted on geographies consisting of 547,425,973 people shows a mild positive correlation between the proportion of Immigrants from Europe and percentage of population with at least 8th grade education in the United States with a correlation coefficient (R) of 0.392 and weighted average of 96.2%. Similarly, the statistical analysis conducted on geographies consisting of 182,604,532 people shows a mild positive correlation between the proportion of South Africans and percentage of population with at least 8th grade education in the United States with a correlation coefficient (R) of 0.379 and weighted average of 96.4%, a difference of 0.16%.
8th Grade Correlation Summary
| Measurement | Immigrants from Europe | South African |
| Minimum | 83.1% | 92.5% |
| Maximum | 100.0% | 100.0% |
| Range | 16.9% | 7.5% |
| Mean | 96.9% | 98.2% |
| Median | 97.1% | 98.3% |
| Interquartile 25% (IQ1) | 95.5% | 97.4% |
| Interquartile 75% (IQ3) | 100.0% | 100.0% |
| Interquartile Range (IQR) | 4.5% | 2.6% |
| Standard Deviation (Sample) | 3.0% | 2.1% |
| Standard Deviation (Population) | 3.0% | 2.0% |
Demographics Similar to Immigrants from Europe and South Africans by 8th Grade
In terms of 8th grade, the demographic groups most similar to Immigrants from Europe are Immigrants from Switzerland (96.2%, a difference of 0.0%), Immigrants from France (96.2%, a difference of 0.0%), Immigrants from Bulgaria (96.2%, a difference of 0.0%), Immigrants from Norway (96.2%, a difference of 0.020%), and Nonimmigrants (96.2%, a difference of 0.030%). Similarly, the demographic groups most similar to South Africans are Immigrants from Saudi Arabia (96.3%, a difference of 0.010%), Kiowa (96.3%, a difference of 0.010%), Immigrants from North Macedonia (96.3%, a difference of 0.010%), Okinawan (96.3%, a difference of 0.020%), and Immigrants from Latvia (96.3%, a difference of 0.030%).
| Demographics | Rating | Rank | 8th Grade |
| South Africans | 98.2 /100 | #102 | Exceptional 96.4% |
| Immigrants | Saudi Arabia | 98.0 /100 | #103 | Exceptional 96.3% |
| Kiowa | 98.0 /100 | #104 | Exceptional 96.3% |
| Immigrants | North Macedonia | 98.0 /100 | #105 | Exceptional 96.3% |
| Okinawans | 98.0 /100 | #106 | Exceptional 96.3% |
| Immigrants | Latvia | 97.8 /100 | #107 | Exceptional 96.3% |
| Lebanese | 97.5 /100 | #108 | Exceptional 96.3% |
| Iroquois | 97.5 /100 | #109 | Exceptional 96.3% |
| Cajuns | 97.1 /100 | #110 | Exceptional 96.3% |
| Shoshone | 96.8 /100 | #111 | Exceptional 96.3% |
| Syrians | 96.7 /100 | #112 | Exceptional 96.3% |
| Immigrants | Zimbabwe | 96.7 /100 | #113 | Exceptional 96.3% |
| Immigrants | Japan | 96.5 /100 | #114 | Exceptional 96.2% |
| Immigrants | Moldova | 96.5 /100 | #115 | Exceptional 96.2% |
| Immigrants | Nonimmigrants | 96.0 /100 | #116 | Exceptional 96.2% |
| Immigrants | Croatia | 96.0 /100 | #117 | Exceptional 96.2% |
| Immigrants | Norway | 95.7 /100 | #118 | Exceptional 96.2% |
| Immigrants | Switzerland | 95.3 /100 | #119 | Exceptional 96.2% |
| Immigrants | France | 95.3 /100 | #120 | Exceptional 96.2% |
| Immigrants | Bulgaria | 95.3 /100 | #121 | Exceptional 96.2% |
| Immigrants | Europe | 95.3 /100 | #122 | Exceptional 96.2% |