Immigrants from Ethiopia vs Puerto Rican Vision Disability
COMPARE
Immigrants from Ethiopia
Puerto Rican
Vision Disability
Vision Disability Comparison
Immigrants from Ethiopia
Puerto Ricans
2.0%
VISION DISABILITY
99.7/ 100
METRIC RATING
42nd/ 347
METRIC RANK
3.9%
VISION DISABILITY
0.0/ 100
METRIC RATING
347th/ 347
METRIC RANK
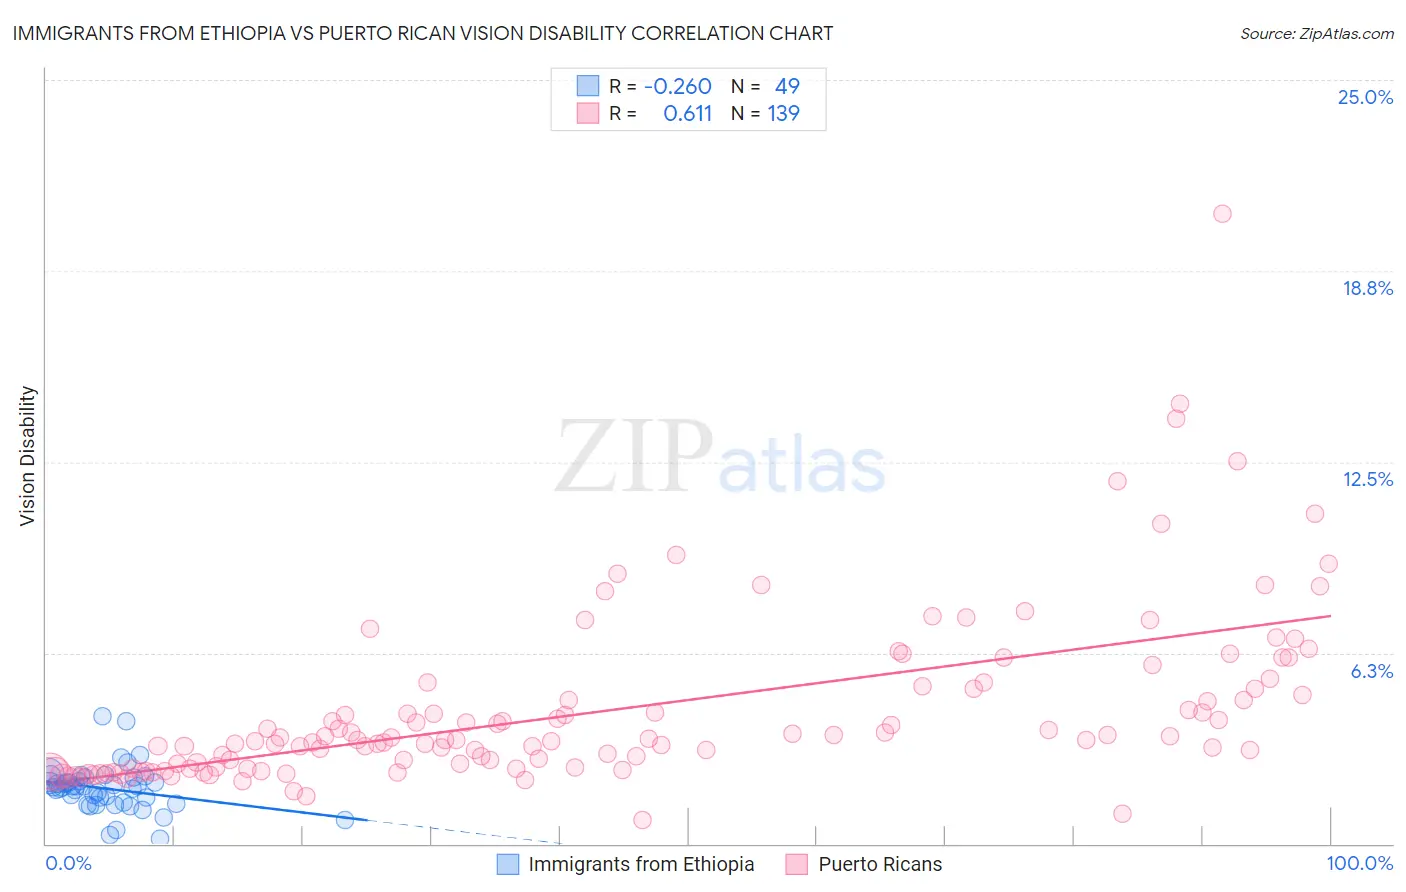
Immigrants from Ethiopia vs Puerto Rican Vision Disability Correlation Chart
The statistical analysis conducted on geographies consisting of 211,444,224 people shows a weak negative correlation between the proportion of Immigrants from Ethiopia and percentage of population with vision disability in the United States with a correlation coefficient (R) of -0.260 and weighted average of 2.0%. Similarly, the statistical analysis conducted on geographies consisting of 527,298,658 people shows a significant positive correlation between the proportion of Puerto Ricans and percentage of population with vision disability in the United States with a correlation coefficient (R) of 0.611 and weighted average of 3.9%, a difference of 96.9%.
Vision Disability Correlation Summary
| Measurement | Immigrants from Ethiopia | Puerto Rican |
| Minimum | 0.17% | 0.78% |
| Maximum | 4.2% | 20.6% |
| Range | 4.0% | 19.8% |
| Mean | 1.8% | 4.4% |
| Median | 1.9% | 3.4% |
| Interquartile 25% (IQ1) | 1.3% | 2.5% |
| Interquartile 75% (IQ3) | 2.1% | 5.1% |
| Interquartile Range (IQR) | 0.79% | 2.6% |
| Standard Deviation (Sample) | 0.74% | 2.9% |
| Standard Deviation (Population) | 0.74% | 2.9% |
Similar Demographics by Vision Disability
Demographics Similar to Immigrants from Ethiopia by Vision Disability
In terms of vision disability, the demographic groups most similar to Immigrants from Ethiopia are Eastern European (2.0%, a difference of 0.060%), Immigrants from Indonesia (2.0%, a difference of 0.090%), Ethiopian (2.0%, a difference of 0.11%), Immigrants from Sweden (2.0%, a difference of 0.15%), and Cypriot (2.0%, a difference of 0.16%).
| Demographics | Rating | Rank | Vision Disability |
| Immigrants | Australia | 99.8 /100 | #35 | Exceptional 1.9% |
| Cambodians | 99.8 /100 | #36 | Exceptional 2.0% |
| Bhutanese | 99.8 /100 | #37 | Exceptional 2.0% |
| Immigrants | Kuwait | 99.8 /100 | #38 | Exceptional 2.0% |
| Zimbabweans | 99.7 /100 | #39 | Exceptional 2.0% |
| Immigrants | Ireland | 99.7 /100 | #40 | Exceptional 2.0% |
| Cypriots | 99.7 /100 | #41 | Exceptional 2.0% |
| Immigrants | Ethiopia | 99.7 /100 | #42 | Exceptional 2.0% |
| Eastern Europeans | 99.7 /100 | #43 | Exceptional 2.0% |
| Immigrants | Indonesia | 99.7 /100 | #44 | Exceptional 2.0% |
| Ethiopians | 99.7 /100 | #45 | Exceptional 2.0% |
| Immigrants | Sweden | 99.7 /100 | #46 | Exceptional 2.0% |
| Immigrants | Bulgaria | 99.7 /100 | #47 | Exceptional 2.0% |
| Israelis | 99.6 /100 | #48 | Exceptional 2.0% |
| Latvians | 99.5 /100 | #49 | Exceptional 2.0% |
Demographics Similar to Puerto Ricans by Vision Disability
In terms of vision disability, the demographic groups most similar to Puerto Ricans are Houma (3.4%, a difference of 12.7%), Lumbee (3.4%, a difference of 14.5%), Pueblo (3.3%, a difference of 16.4%), Pima (3.3%, a difference of 16.4%), and Choctaw (3.3%, a difference of 17.6%).
| Demographics | Rating | Rank | Vision Disability |
| Cajuns | 0.0 /100 | #333 | Tragic 3.1% |
| Cheyenne | 0.0 /100 | #334 | Tragic 3.1% |
| Navajo | 0.0 /100 | #335 | Tragic 3.1% |
| Alaskan Athabascans | 0.0 /100 | #336 | Tragic 3.1% |
| Dutch West Indians | 0.0 /100 | #337 | Tragic 3.2% |
| Chickasaw | 0.0 /100 | #338 | Tragic 3.2% |
| Tsimshian | 0.0 /100 | #339 | Tragic 3.2% |
| Creek | 0.0 /100 | #340 | Tragic 3.2% |
| Kiowa | 0.0 /100 | #341 | Tragic 3.3% |
| Choctaw | 0.0 /100 | #342 | Tragic 3.3% |
| Pima | 0.0 /100 | #343 | Tragic 3.3% |
| Pueblo | 0.0 /100 | #344 | Tragic 3.3% |
| Lumbee | 0.0 /100 | #345 | Tragic 3.4% |
| Houma | 0.0 /100 | #346 | Tragic 3.4% |
| Puerto Ricans | 0.0 /100 | #347 | Tragic 3.9% |