Immigrants from Ethiopia vs Malaysian Married-couple Households
COMPARE
Immigrants from Ethiopia
Malaysian
Married-couple Households
Married-couple Households Comparison
Immigrants from Ethiopia
Malaysians
43.1%
MARRIED-COUPLE HOUSEHOLDS
0.0/ 100
METRIC RATING
276th/ 347
METRIC RANK
46.3%
MARRIED-COUPLE HOUSEHOLDS
41.8/ 100
METRIC RATING
181st/ 347
METRIC RANK
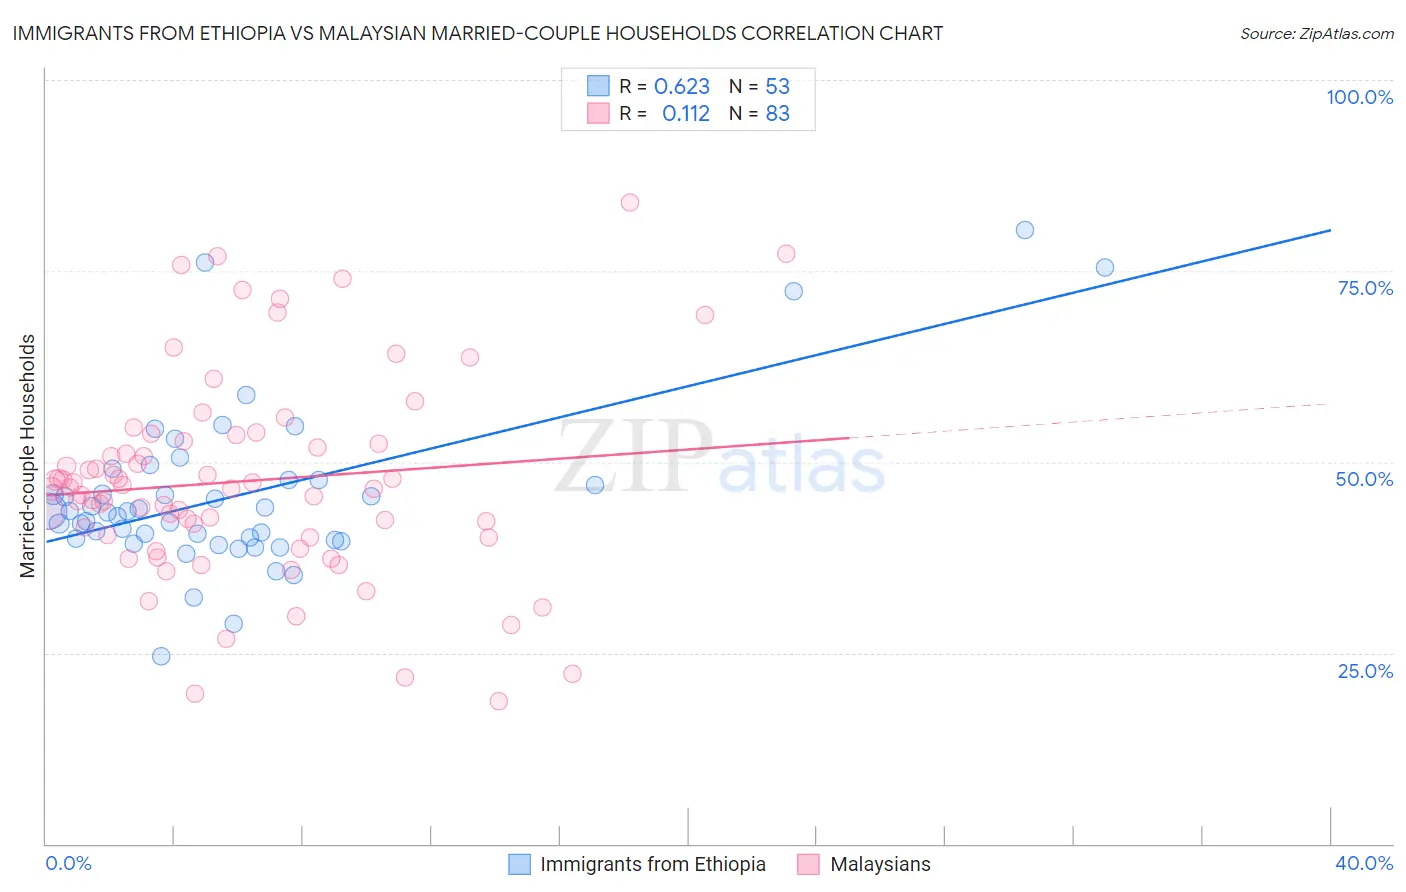
Immigrants from Ethiopia vs Malaysian Married-couple Households Correlation Chart
The statistical analysis conducted on geographies consisting of 211,463,279 people shows a significant positive correlation between the proportion of Immigrants from Ethiopia and percentage of married-couple family households in the United States with a correlation coefficient (R) of 0.623 and weighted average of 43.1%. Similarly, the statistical analysis conducted on geographies consisting of 226,006,670 people shows a poor positive correlation between the proportion of Malaysians and percentage of married-couple family households in the United States with a correlation coefficient (R) of 0.112 and weighted average of 46.3%, a difference of 7.5%.
Married-couple Households Correlation Summary
| Measurement | Immigrants from Ethiopia | Malaysian |
| Minimum | 24.6% | 18.6% |
| Maximum | 80.4% | 84.0% |
| Range | 55.7% | 65.4% |
| Mean | 45.5% | 47.5% |
| Median | 43.5% | 46.5% |
| Interquartile 25% (IQ1) | 39.9% | 40.1% |
| Interquartile 75% (IQ3) | 47.7% | 52.7% |
| Interquartile Range (IQR) | 7.8% | 12.6% |
| Standard Deviation (Sample) | 10.7% | 13.3% |
| Standard Deviation (Population) | 10.6% | 13.2% |
Similar Demographics by Married-couple Households
Demographics Similar to Immigrants from Ethiopia by Married-couple Households
In terms of married-couple households, the demographic groups most similar to Immigrants from Ethiopia are Immigrants from Bangladesh (43.1%, a difference of 0.11%), Nigerian (43.2%, a difference of 0.25%), Ethiopian (43.2%, a difference of 0.26%), Immigrants from Eastern Africa (42.9%, a difference of 0.26%), and Immigrants from Nigeria (43.2%, a difference of 0.36%).
| Demographics | Rating | Rank | Married-couple Households |
| Immigrants | Sierra Leone | 0.1 /100 | #269 | Tragic 43.3% |
| Yuman | 0.1 /100 | #270 | Tragic 43.3% |
| Guatemalans | 0.1 /100 | #271 | Tragic 43.3% |
| Immigrants | Nigeria | 0.1 /100 | #272 | Tragic 43.2% |
| Ethiopians | 0.1 /100 | #273 | Tragic 43.2% |
| Nigerians | 0.1 /100 | #274 | Tragic 43.2% |
| Immigrants | Bangladesh | 0.0 /100 | #275 | Tragic 43.1% |
| Immigrants | Ethiopia | 0.0 /100 | #276 | Tragic 43.1% |
| Immigrants | Eastern Africa | 0.0 /100 | #277 | Tragic 42.9% |
| Immigrants | Africa | 0.0 /100 | #278 | Tragic 42.9% |
| Sierra Leoneans | 0.0 /100 | #279 | Tragic 42.9% |
| Immigrants | Ecuador | 0.0 /100 | #280 | Tragic 42.9% |
| Immigrants | Guatemala | 0.0 /100 | #281 | Tragic 42.8% |
| Bermudans | 0.0 /100 | #282 | Tragic 42.4% |
| Inupiat | 0.0 /100 | #283 | Tragic 42.4% |
Demographics Similar to Malaysians by Married-couple Households
In terms of married-couple households, the demographic groups most similar to Malaysians are Mongolian (46.3%, a difference of 0.010%), Immigrants from Zimbabwe (46.3%, a difference of 0.050%), Immigrants from Costa Rica (46.3%, a difference of 0.060%), Immigrants (46.3%, a difference of 0.080%), and Yugoslavian (46.2%, a difference of 0.12%).
| Demographics | Rating | Rank | Married-couple Households |
| Immigrants | Mexico | 50.0 /100 | #174 | Average 46.4% |
| Immigrants | Colombia | 46.1 /100 | #175 | Average 46.4% |
| Cajuns | 45.2 /100 | #176 | Average 46.4% |
| Immigrants | Immigrants | 43.8 /100 | #177 | Average 46.3% |
| Immigrants | Costa Rica | 43.4 /100 | #178 | Average 46.3% |
| Immigrants | Zimbabwe | 43.0 /100 | #179 | Average 46.3% |
| Mongolians | 42.0 /100 | #180 | Average 46.3% |
| Malaysians | 41.8 /100 | #181 | Average 46.3% |
| Yugoslavians | 38.9 /100 | #182 | Fair 46.2% |
| Immigrants | Brazil | 38.3 /100 | #183 | Fair 46.2% |
| Immigrants | Switzerland | 36.9 /100 | #184 | Fair 46.2% |
| Brazilians | 35.9 /100 | #185 | Fair 46.2% |
| Albanians | 31.1 /100 | #186 | Fair 46.1% |
| Fijians | 29.2 /100 | #187 | Fair 46.1% |
| South American Indians | 28.4 /100 | #188 | Fair 46.0% |