Immigrants from Ethiopia vs Immigrants from Korea Male Disability
COMPARE
Immigrants from Ethiopia
Immigrants from Korea
Male Disability
Male Disability Comparison
Immigrants from Ethiopia
Immigrants from Korea
10.2%
MALE DISABILITY
99.9/ 100
METRIC RATING
33rd/ 347
METRIC RANK
9.8%
MALE DISABILITY
100.0/ 100
METRIC RATING
17th/ 347
METRIC RANK
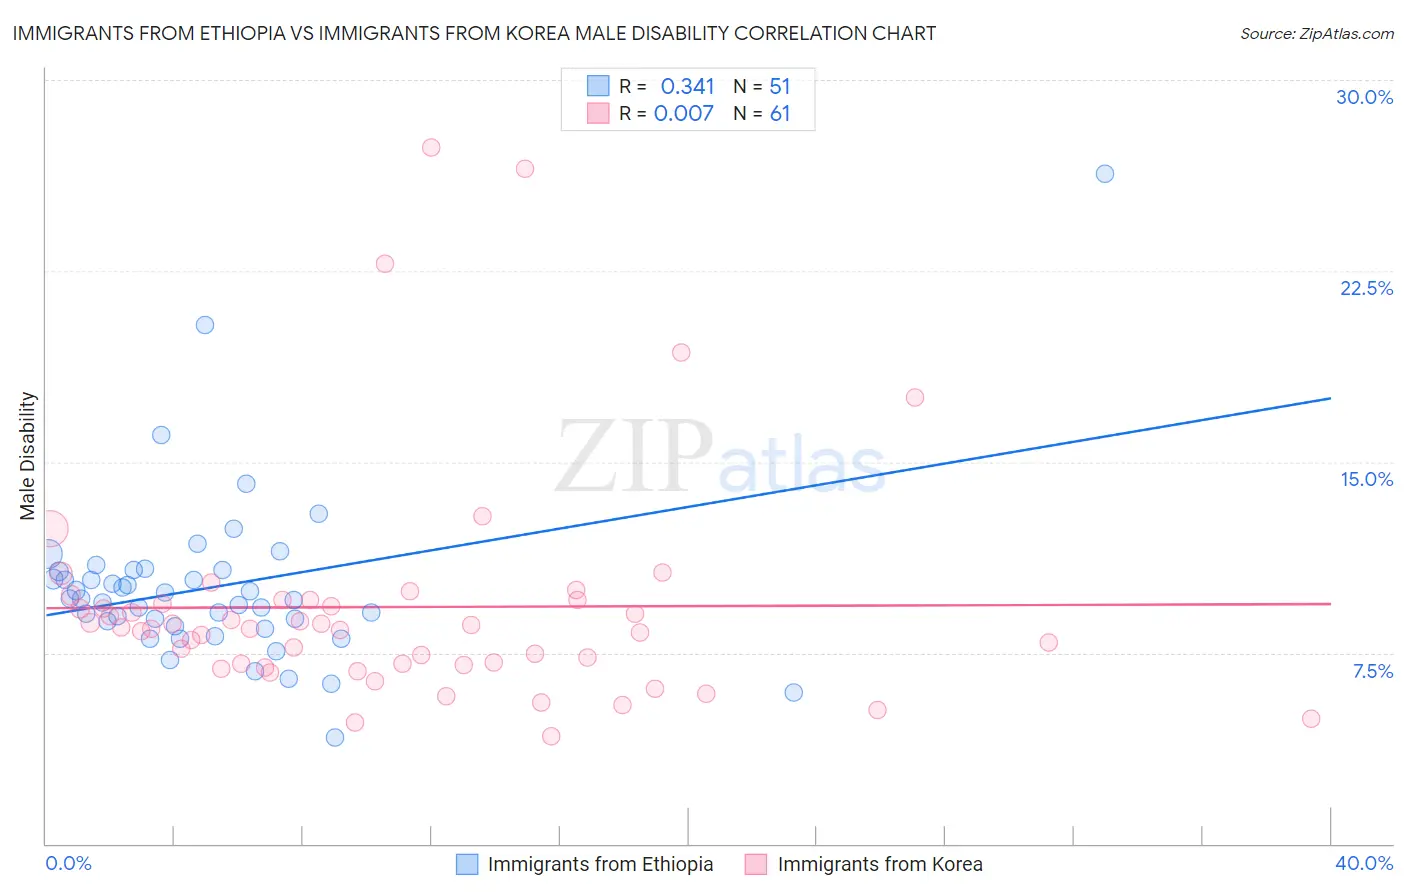
Immigrants from Ethiopia vs Immigrants from Korea Male Disability Correlation Chart
The statistical analysis conducted on geographies consisting of 211,544,551 people shows a mild positive correlation between the proportion of Immigrants from Ethiopia and percentage of males with a disability in the United States with a correlation coefficient (R) of 0.341 and weighted average of 10.2%. Similarly, the statistical analysis conducted on geographies consisting of 416,248,293 people shows no correlation between the proportion of Immigrants from Korea and percentage of males with a disability in the United States with a correlation coefficient (R) of 0.007 and weighted average of 9.8%, a difference of 4.0%.
Male Disability Correlation Summary
| Measurement | Immigrants from Ethiopia | Immigrants from Korea |
| Minimum | 4.2% | 4.2% |
| Maximum | 26.3% | 27.3% |
| Range | 22.2% | 23.1% |
| Mean | 10.1% | 9.3% |
| Median | 9.6% | 8.5% |
| Interquartile 25% (IQ1) | 8.6% | 7.0% |
| Interquartile 75% (IQ3) | 10.8% | 9.6% |
| Interquartile Range (IQR) | 2.2% | 2.5% |
| Standard Deviation (Sample) | 3.4% | 4.5% |
| Standard Deviation (Population) | 3.4% | 4.5% |
Demographics Similar to Immigrants from Ethiopia and Immigrants from Korea by Male Disability
In terms of male disability, the demographic groups most similar to Immigrants from Ethiopia are Immigrants from Turkey (10.2%, a difference of 0.060%), Immigrants from Argentina (10.2%, a difference of 0.17%), Argentinean (10.1%, a difference of 0.50%), Soviet Union (10.1%, a difference of 0.66%), and Immigrants from Egypt (10.1%, a difference of 0.72%). Similarly, the demographic groups most similar to Immigrants from Korea are Okinawan (9.8%, a difference of 0.14%), Immigrants from Pakistan (9.8%, a difference of 0.56%), Indian (Asian) (9.7%, a difference of 0.75%), Immigrants from Sri Lanka (10.0%, a difference of 1.7%), and Asian (10.0%, a difference of 1.8%).
| Demographics | Rating | Rank | Male Disability |
| Indians (Asian) | 100.0 /100 | #15 | Exceptional 9.7% |
| Okinawans | 100.0 /100 | #16 | Exceptional 9.8% |
| Immigrants | Korea | 100.0 /100 | #17 | Exceptional 9.8% |
| Immigrants | Pakistan | 100.0 /100 | #18 | Exceptional 9.8% |
| Immigrants | Sri Lanka | 100.0 /100 | #19 | Exceptional 10.0% |
| Asians | 100.0 /100 | #20 | Exceptional 10.0% |
| Burmese | 100.0 /100 | #21 | Exceptional 10.0% |
| Immigrants | Venezuela | 100.0 /100 | #22 | Exceptional 10.0% |
| Cypriots | 100.0 /100 | #23 | Exceptional 10.0% |
| Immigrants | Asia | 100.0 /100 | #24 | Exceptional 10.0% |
| Immigrants | Malaysia | 99.9 /100 | #25 | Exceptional 10.0% |
| Paraguayans | 99.9 /100 | #26 | Exceptional 10.1% |
| Egyptians | 99.9 /100 | #27 | Exceptional 10.1% |
| Vietnamese | 99.9 /100 | #28 | Exceptional 10.1% |
| Venezuelans | 99.9 /100 | #29 | Exceptional 10.1% |
| Immigrants | Egypt | 99.9 /100 | #30 | Exceptional 10.1% |
| Soviet Union | 99.9 /100 | #31 | Exceptional 10.1% |
| Argentineans | 99.9 /100 | #32 | Exceptional 10.1% |
| Immigrants | Ethiopia | 99.9 /100 | #33 | Exceptional 10.2% |
| Immigrants | Turkey | 99.9 /100 | #34 | Exceptional 10.2% |
| Immigrants | Argentina | 99.9 /100 | #35 | Exceptional 10.2% |