Immigrants from Ethiopia vs New Zealander Male Disability
COMPARE
Immigrants from Ethiopia
New Zealander
Male Disability
Male Disability Comparison
Immigrants from Ethiopia
New Zealanders
10.2%
MALE DISABILITY
99.9/ 100
METRIC RATING
33rd/ 347
METRIC RANK
11.2%
MALE DISABILITY
52.9/ 100
METRIC RATING
170th/ 347
METRIC RANK
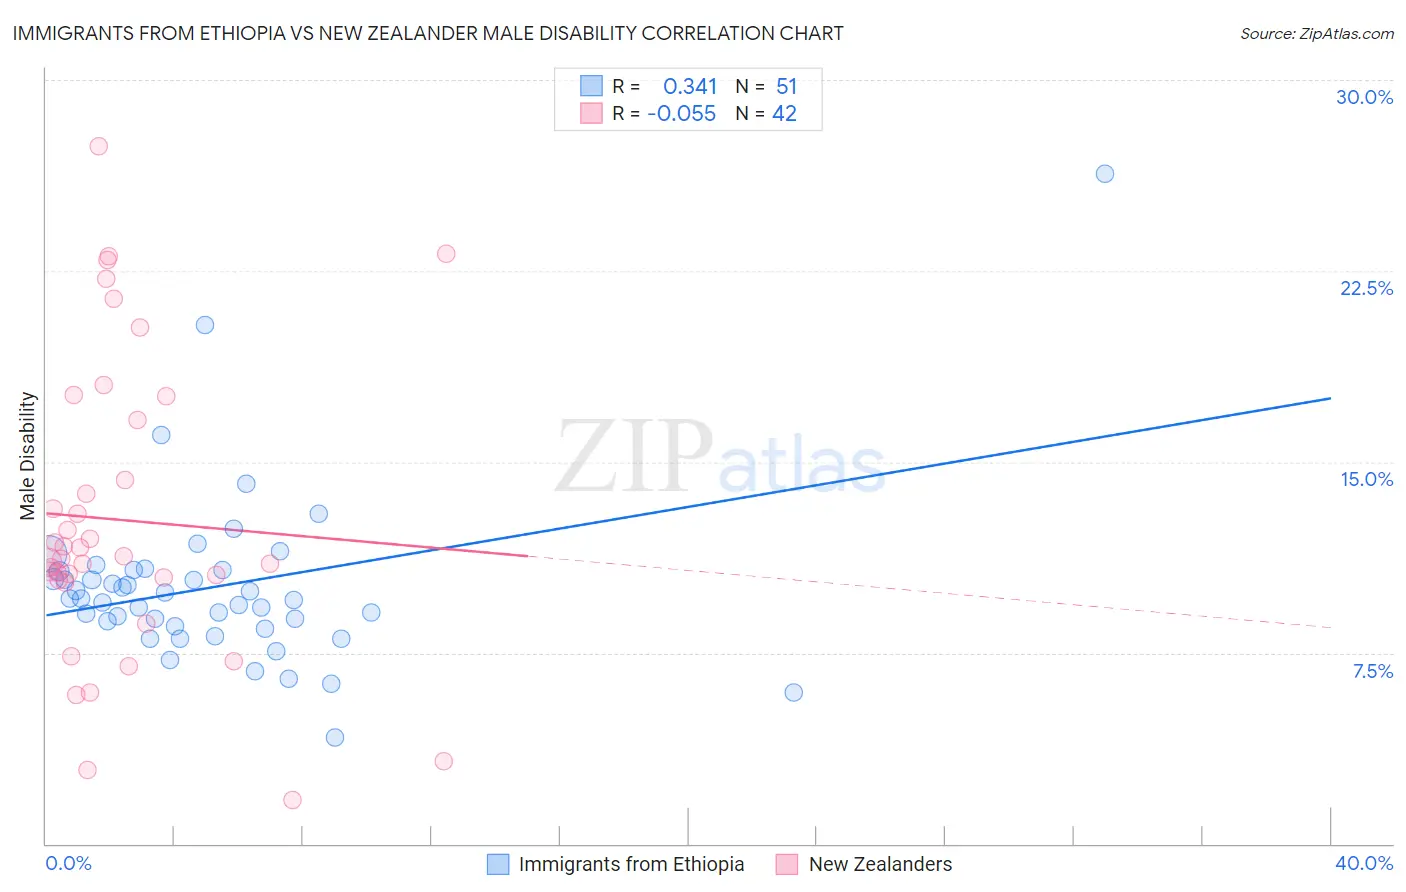
Immigrants from Ethiopia vs New Zealander Male Disability Correlation Chart
The statistical analysis conducted on geographies consisting of 211,544,551 people shows a mild positive correlation between the proportion of Immigrants from Ethiopia and percentage of males with a disability in the United States with a correlation coefficient (R) of 0.341 and weighted average of 10.2%. Similarly, the statistical analysis conducted on geographies consisting of 106,918,286 people shows a slight negative correlation between the proportion of New Zealanders and percentage of males with a disability in the United States with a correlation coefficient (R) of -0.055 and weighted average of 11.2%, a difference of 9.9%.
Male Disability Correlation Summary
| Measurement | Immigrants from Ethiopia | New Zealander |
| Minimum | 4.2% | 1.7% |
| Maximum | 26.3% | 27.4% |
| Range | 22.2% | 25.7% |
| Mean | 10.1% | 12.7% |
| Median | 9.6% | 11.3% |
| Interquartile 25% (IQ1) | 8.6% | 10.4% |
| Interquartile 75% (IQ3) | 10.8% | 16.7% |
| Interquartile Range (IQR) | 2.2% | 6.3% |
| Standard Deviation (Sample) | 3.4% | 5.9% |
| Standard Deviation (Population) | 3.4% | 5.8% |
Similar Demographics by Male Disability
Demographics Similar to Immigrants from Ethiopia by Male Disability
In terms of male disability, the demographic groups most similar to Immigrants from Ethiopia are Immigrants from Turkey (10.2%, a difference of 0.060%), Immigrants from Argentina (10.2%, a difference of 0.17%), Ethiopian (10.2%, a difference of 0.22%), Immigrants from Indonesia (10.2%, a difference of 0.30%), and Immigrants from Kuwait (10.2%, a difference of 0.47%).
| Demographics | Rating | Rank | Male Disability |
| Paraguayans | 99.9 /100 | #26 | Exceptional 10.1% |
| Egyptians | 99.9 /100 | #27 | Exceptional 10.1% |
| Vietnamese | 99.9 /100 | #28 | Exceptional 10.1% |
| Venezuelans | 99.9 /100 | #29 | Exceptional 10.1% |
| Immigrants | Egypt | 99.9 /100 | #30 | Exceptional 10.1% |
| Soviet Union | 99.9 /100 | #31 | Exceptional 10.1% |
| Argentineans | 99.9 /100 | #32 | Exceptional 10.1% |
| Immigrants | Ethiopia | 99.9 /100 | #33 | Exceptional 10.2% |
| Immigrants | Turkey | 99.9 /100 | #34 | Exceptional 10.2% |
| Immigrants | Argentina | 99.9 /100 | #35 | Exceptional 10.2% |
| Ethiopians | 99.8 /100 | #36 | Exceptional 10.2% |
| Immigrants | Indonesia | 99.8 /100 | #37 | Exceptional 10.2% |
| Immigrants | Kuwait | 99.8 /100 | #38 | Exceptional 10.2% |
| Afghans | 99.8 /100 | #39 | Exceptional 10.2% |
| Immigrants | Nepal | 99.8 /100 | #40 | Exceptional 10.3% |
Demographics Similar to New Zealanders by Male Disability
In terms of male disability, the demographic groups most similar to New Zealanders are Haitian (11.2%, a difference of 0.020%), Barbadian (11.2%, a difference of 0.030%), Immigrants from Latin America (11.2%, a difference of 0.060%), Immigrants from Southern Europe (11.2%, a difference of 0.080%), and Romanian (11.2%, a difference of 0.12%).
| Demographics | Rating | Rank | Male Disability |
| Immigrants | Kenya | 63.8 /100 | #163 | Good 11.1% |
| British West Indians | 62.8 /100 | #164 | Good 11.1% |
| Luxembourgers | 61.9 /100 | #165 | Good 11.1% |
| Immigrants | Hungary | 61.2 /100 | #166 | Good 11.1% |
| Immigrants | Southern Europe | 54.4 /100 | #167 | Average 11.2% |
| Immigrants | Latin America | 54.0 /100 | #168 | Average 11.2% |
| Barbadians | 53.4 /100 | #169 | Average 11.2% |
| New Zealanders | 52.9 /100 | #170 | Average 11.2% |
| Haitians | 52.5 /100 | #171 | Average 11.2% |
| Romanians | 50.7 /100 | #172 | Average 11.2% |
| Immigrants | Burma/Myanmar | 50.4 /100 | #173 | Average 11.2% |
| Maltese | 50.0 /100 | #174 | Average 11.2% |
| Immigrants | Honduras | 48.7 /100 | #175 | Average 11.2% |
| Syrians | 46.6 /100 | #176 | Average 11.2% |
| Immigrants | Norway | 44.2 /100 | #177 | Average 11.3% |