Estonian vs Immigrants from Korea Male Disability
COMPARE
Estonian
Immigrants from Korea
Male Disability
Male Disability Comparison
Estonians
Immigrants from Korea
11.4%
MALE DISABILITY
26.8/ 100
METRIC RATING
188th/ 347
METRIC RANK
9.8%
MALE DISABILITY
100.0/ 100
METRIC RATING
17th/ 347
METRIC RANK
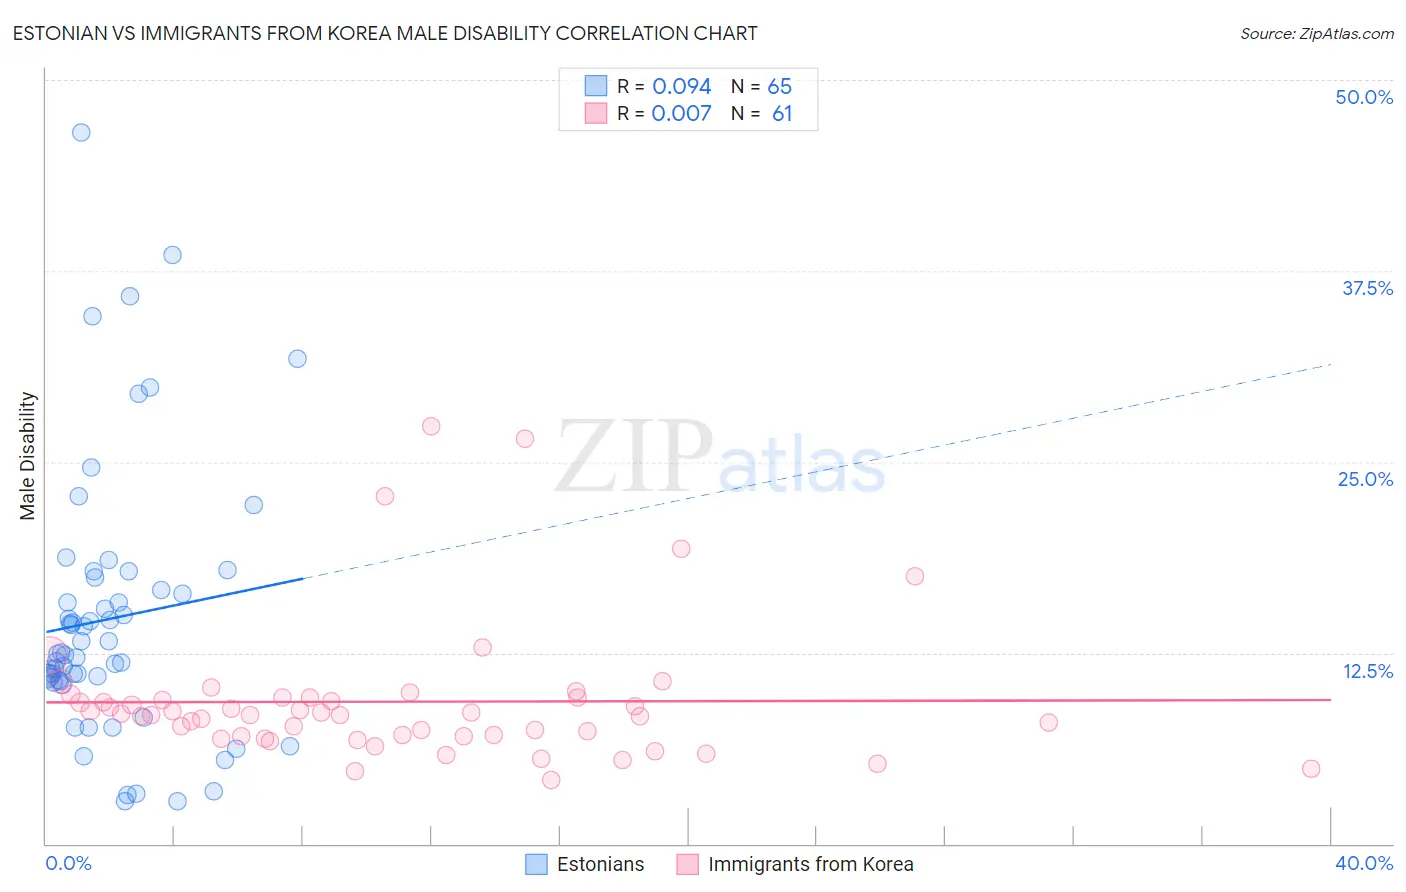
Estonian vs Immigrants from Korea Male Disability Correlation Chart
The statistical analysis conducted on geographies consisting of 123,527,387 people shows a slight positive correlation between the proportion of Estonians and percentage of males with a disability in the United States with a correlation coefficient (R) of 0.094 and weighted average of 11.4%. Similarly, the statistical analysis conducted on geographies consisting of 416,248,293 people shows no correlation between the proportion of Immigrants from Korea and percentage of males with a disability in the United States with a correlation coefficient (R) of 0.007 and weighted average of 9.8%, a difference of 16.2%.
Male Disability Correlation Summary
| Measurement | Estonian | Immigrants from Korea |
| Minimum | 2.8% | 4.2% |
| Maximum | 46.6% | 27.3% |
| Range | 43.8% | 23.1% |
| Mean | 14.7% | 9.3% |
| Median | 12.5% | 8.5% |
| Interquartile 25% (IQ1) | 10.7% | 7.0% |
| Interquartile 75% (IQ3) | 17.0% | 9.6% |
| Interquartile Range (IQR) | 6.3% | 2.5% |
| Standard Deviation (Sample) | 8.7% | 4.5% |
| Standard Deviation (Population) | 8.7% | 4.5% |
Similar Demographics by Male Disability
Demographics Similar to Estonians by Male Disability
In terms of male disability, the demographic groups most similar to Estonians are Immigrants from Austria (11.4%, a difference of 0.040%), Immigrants from Zaire (11.4%, a difference of 0.060%), Immigrants from Netherlands (11.4%, a difference of 0.060%), Immigrants from Bosnia and Herzegovina (11.4%, a difference of 0.10%), and Pakistani (11.3%, a difference of 0.24%).
| Demographics | Rating | Rank | Male Disability |
| Immigrants | Senegal | 34.4 /100 | #181 | Fair 11.3% |
| Immigrants | Belize | 33.7 /100 | #182 | Fair 11.3% |
| Immigrants | Central America | 32.9 /100 | #183 | Fair 11.3% |
| Iraqis | 30.5 /100 | #184 | Fair 11.3% |
| Pakistanis | 30.3 /100 | #185 | Fair 11.3% |
| Immigrants | Zaire | 27.6 /100 | #186 | Fair 11.4% |
| Immigrants | Austria | 27.3 /100 | #187 | Fair 11.4% |
| Estonians | 26.8 /100 | #188 | Fair 11.4% |
| Immigrants | Netherlands | 25.9 /100 | #189 | Fair 11.4% |
| Immigrants | Bosnia and Herzegovina | 25.4 /100 | #190 | Fair 11.4% |
| Senegalese | 23.2 /100 | #191 | Fair 11.4% |
| Assyrians/Chaldeans/Syriacs | 23.2 /100 | #192 | Fair 11.4% |
| Greeks | 22.2 /100 | #193 | Fair 11.4% |
| Belizeans | 21.2 /100 | #194 | Fair 11.4% |
| Immigrants | Oceania | 20.9 /100 | #195 | Fair 11.4% |
Demographics Similar to Immigrants from Korea by Male Disability
In terms of male disability, the demographic groups most similar to Immigrants from Korea are Okinawan (9.8%, a difference of 0.14%), Immigrants from Pakistan (9.8%, a difference of 0.56%), Indian (Asian) (9.7%, a difference of 0.75%), Immigrants from Iran (9.7%, a difference of 1.2%), and Iranian (9.7%, a difference of 1.3%).
| Demographics | Rating | Rank | Male Disability |
| Immigrants | Israel | 100.0 /100 | #10 | Exceptional 9.6% |
| Immigrants | Eastern Asia | 100.0 /100 | #11 | Exceptional 9.6% |
| Bolivians | 100.0 /100 | #12 | Exceptional 9.6% |
| Iranians | 100.0 /100 | #13 | Exceptional 9.7% |
| Immigrants | Iran | 100.0 /100 | #14 | Exceptional 9.7% |
| Indians (Asian) | 100.0 /100 | #15 | Exceptional 9.7% |
| Okinawans | 100.0 /100 | #16 | Exceptional 9.8% |
| Immigrants | Korea | 100.0 /100 | #17 | Exceptional 9.8% |
| Immigrants | Pakistan | 100.0 /100 | #18 | Exceptional 9.8% |
| Immigrants | Sri Lanka | 100.0 /100 | #19 | Exceptional 10.0% |
| Asians | 100.0 /100 | #20 | Exceptional 10.0% |
| Burmese | 100.0 /100 | #21 | Exceptional 10.0% |
| Immigrants | Venezuela | 100.0 /100 | #22 | Exceptional 10.0% |
| Cypriots | 100.0 /100 | #23 | Exceptional 10.0% |
| Immigrants | Asia | 100.0 /100 | #24 | Exceptional 10.0% |