Immigrants from Eritrea vs Liberian Disability Age Under 5
COMPARE
Immigrants from Eritrea
Liberian
Disability Age Under 5
Disability Age Under 5 Comparison
Immigrants from Eritrea
Liberians
1.2%
DISABILITY AGE UNDER 5
92.3/ 100
METRIC RATING
120th/ 347
METRIC RANK
1.3%
DISABILITY AGE UNDER 5
24.0/ 100
METRIC RATING
203rd/ 347
METRIC RANK
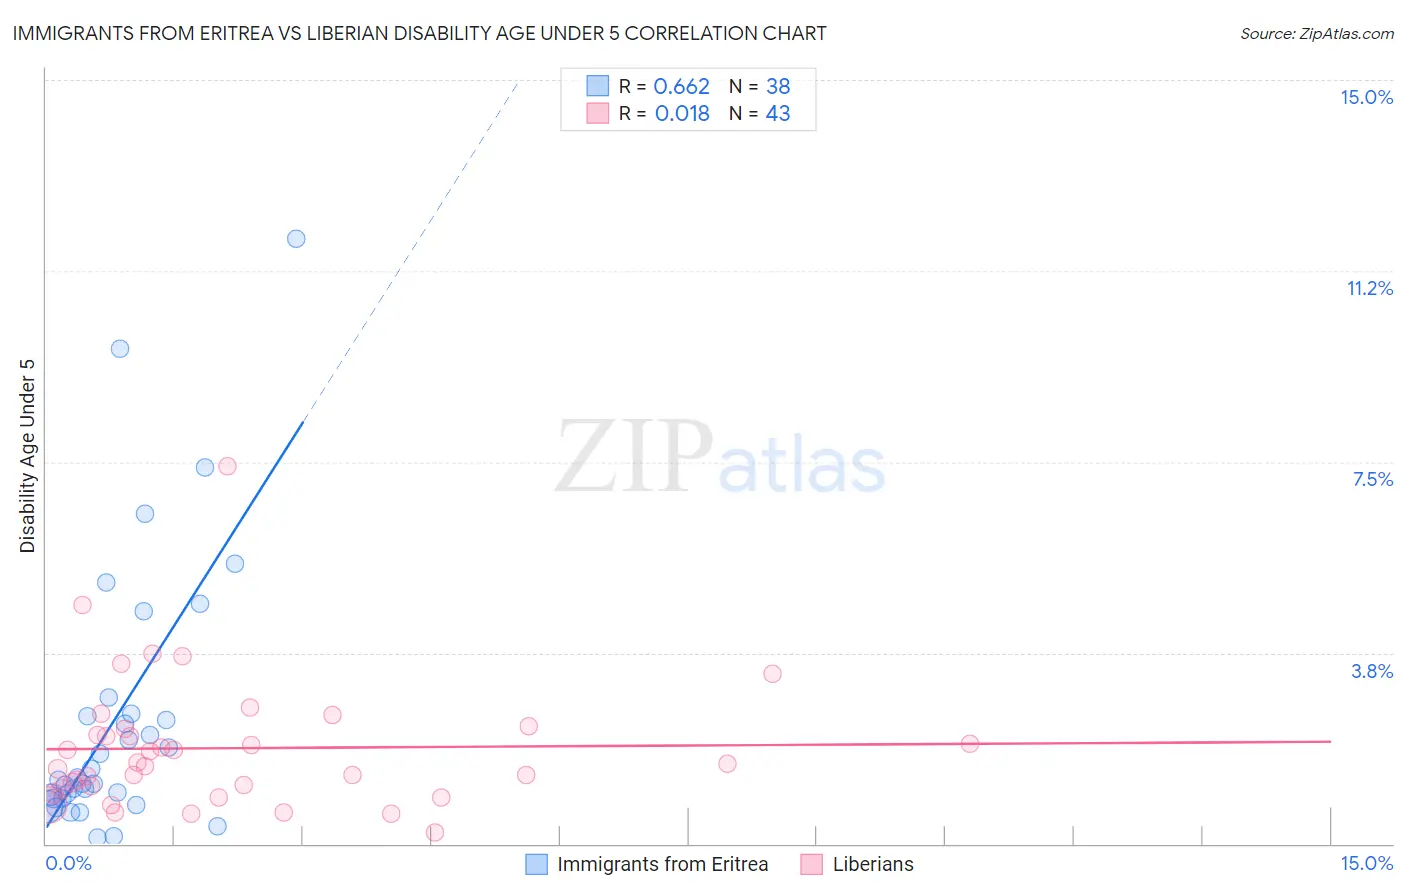
Immigrants from Eritrea vs Liberian Disability Age Under 5 Correlation Chart
The statistical analysis conducted on geographies consisting of 83,045,711 people shows a significant positive correlation between the proportion of Immigrants from Eritrea and percentage of population with a disability under the age of 5 in the United States with a correlation coefficient (R) of 0.662 and weighted average of 1.2%. Similarly, the statistical analysis conducted on geographies consisting of 88,330,984 people shows no correlation between the proportion of Liberians and percentage of population with a disability under the age of 5 in the United States with a correlation coefficient (R) of 0.018 and weighted average of 1.3%, a difference of 8.7%.
Disability Age Under 5 Correlation Summary
| Measurement | Immigrants from Eritrea | Liberian |
| Minimum | 0.12% | 0.22% |
| Maximum | 11.9% | 7.4% |
| Range | 11.8% | 7.2% |
| Mean | 2.5% | 1.9% |
| Median | 1.3% | 1.6% |
| Interquartile 25% (IQ1) | 0.90% | 1.1% |
| Interquartile 75% (IQ3) | 2.5% | 2.3% |
| Interquartile Range (IQR) | 1.6% | 1.2% |
| Standard Deviation (Sample) | 2.7% | 1.3% |
| Standard Deviation (Population) | 2.6% | 1.3% |
Similar Demographics by Disability Age Under 5
Demographics Similar to Immigrants from Eritrea by Disability Age Under 5
In terms of disability age under 5, the demographic groups most similar to Immigrants from Eritrea are Bhutanese (1.2%, a difference of 0.070%), Immigrants from Senegal (1.2%, a difference of 0.28%), Immigrants from Venezuela (1.2%, a difference of 0.41%), Immigrants from Philippines (1.2%, a difference of 0.44%), and Aleut (1.2%, a difference of 0.47%).
| Demographics | Rating | Rank | Disability Age Under 5 |
| Immigrants | Oceania | 94.2 /100 | #113 | Exceptional 1.2% |
| Belizeans | 93.9 /100 | #114 | Exceptional 1.2% |
| Immigrants | Caribbean | 93.8 /100 | #115 | Exceptional 1.2% |
| Immigrants | Northern Africa | 93.8 /100 | #116 | Exceptional 1.2% |
| Immigrants | Philippines | 93.5 /100 | #117 | Exceptional 1.2% |
| Immigrants | Venezuela | 93.4 /100 | #118 | Exceptional 1.2% |
| Bhutanese | 92.5 /100 | #119 | Exceptional 1.2% |
| Immigrants | Eritrea | 92.3 /100 | #120 | Exceptional 1.2% |
| Immigrants | Senegal | 91.4 /100 | #121 | Exceptional 1.2% |
| Aleuts | 90.7 /100 | #122 | Exceptional 1.2% |
| Zimbabweans | 90.6 /100 | #123 | Exceptional 1.2% |
| Immigrants | Cambodia | 90.5 /100 | #124 | Exceptional 1.2% |
| Japanese | 90.3 /100 | #125 | Exceptional 1.2% |
| Central Americans | 89.7 /100 | #126 | Excellent 1.2% |
| Immigrants | Romania | 88.4 /100 | #127 | Excellent 1.2% |
Demographics Similar to Liberians by Disability Age Under 5
In terms of disability age under 5, the demographic groups most similar to Liberians are Arapaho (1.3%, a difference of 0.020%), Immigrants from Europe (1.3%, a difference of 0.050%), Immigrants from Italy (1.3%, a difference of 0.16%), Romanian (1.3%, a difference of 0.18%), and Immigrants from Poland (1.3%, a difference of 0.20%).
| Demographics | Rating | Rank | Disability Age Under 5 |
| Immigrants | Belgium | 31.4 /100 | #196 | Fair 1.3% |
| Immigrants | Somalia | 31.3 /100 | #197 | Fair 1.3% |
| Immigrants | Norway | 31.1 /100 | #198 | Fair 1.3% |
| Jamaicans | 30.7 /100 | #199 | Fair 1.3% |
| Immigrants | Lithuania | 27.2 /100 | #200 | Fair 1.3% |
| Immigrants | Italy | 25.4 /100 | #201 | Fair 1.3% |
| Arapaho | 24.1 /100 | #202 | Fair 1.3% |
| Liberians | 24.0 /100 | #203 | Fair 1.3% |
| Immigrants | Europe | 23.6 /100 | #204 | Fair 1.3% |
| Romanians | 22.5 /100 | #205 | Fair 1.3% |
| Immigrants | Poland | 22.4 /100 | #206 | Fair 1.3% |
| Nigerians | 21.2 /100 | #207 | Fair 1.3% |
| Mexicans | 20.8 /100 | #208 | Fair 1.3% |
| Bulgarians | 19.5 /100 | #209 | Poor 1.3% |
| Pakistanis | 19.4 /100 | #210 | Poor 1.3% |