Immigrants from Eritrea vs Norwegian Per Capita Income
COMPARE
Immigrants from Eritrea
Norwegian
Per Capita Income
Per Capita Income Comparison
Immigrants from Eritrea
Norwegians
$44,509
PER CAPITA INCOME
72.1/ 100
METRIC RATING
150th/ 347
METRIC RANK
$44,480
PER CAPITA INCOME
71.5/ 100
METRIC RATING
151st/ 347
METRIC RANK
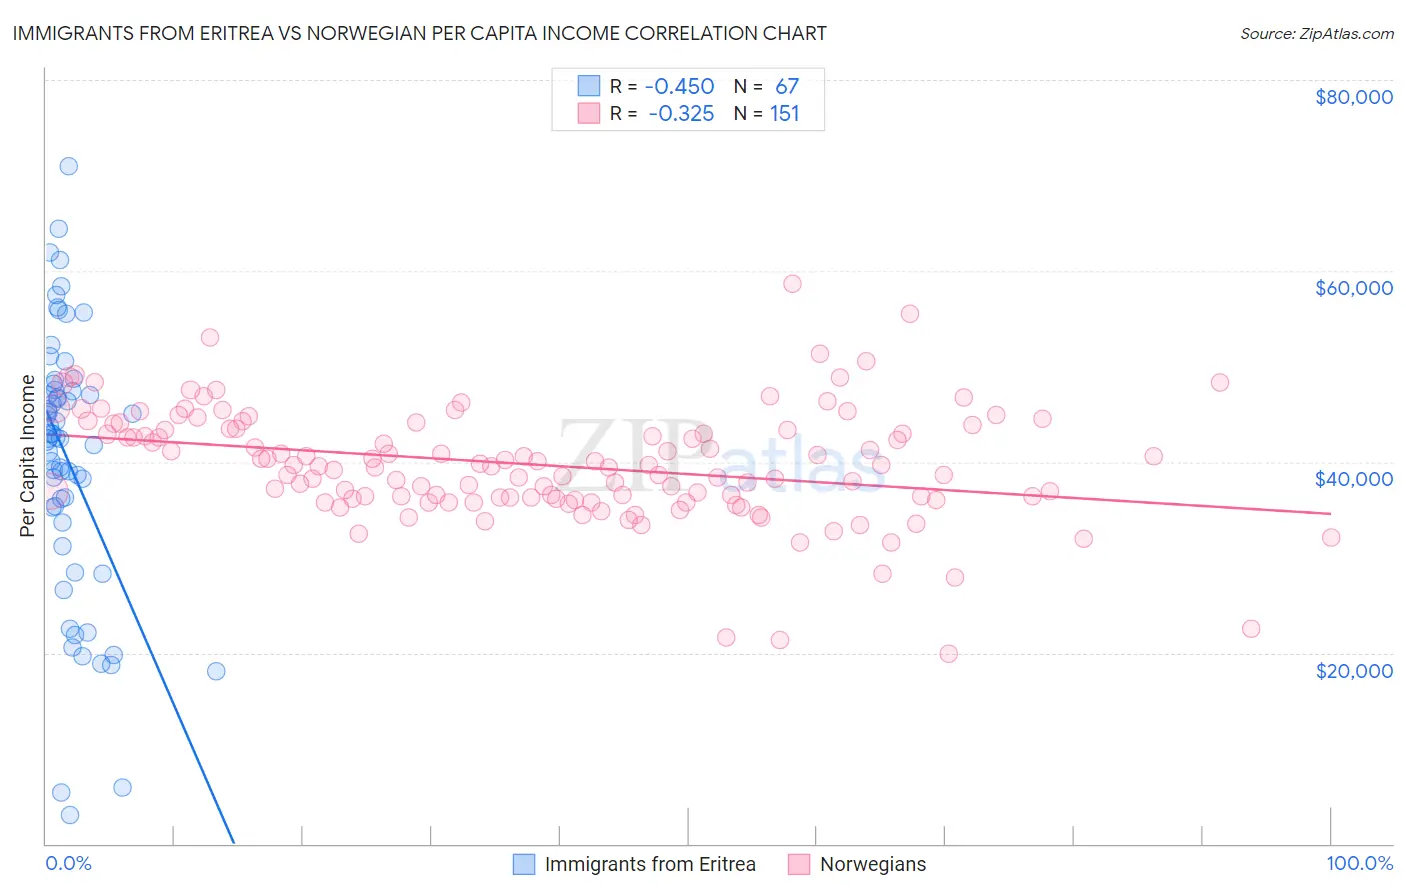
Immigrants from Eritrea vs Norwegian Per Capita Income Correlation Chart
The statistical analysis conducted on geographies consisting of 104,855,166 people shows a moderate negative correlation between the proportion of Immigrants from Eritrea and per capita income in the United States with a correlation coefficient (R) of -0.450 and weighted average of $44,509. Similarly, the statistical analysis conducted on geographies consisting of 533,432,025 people shows a mild negative correlation between the proportion of Norwegians and per capita income in the United States with a correlation coefficient (R) of -0.325 and weighted average of $44,480, a difference of 0.060%.
Per Capita Income Correlation Summary
| Measurement | Immigrants from Eritrea | Norwegian |
| Minimum | $3,067 | $19,862 |
| Maximum | $70,972 | $58,625 |
| Range | $67,905 | $38,763 |
| Mean | $39,964 | $39,667 |
| Median | $42,389 | $39,585 |
| Interquartile 25% (IQ1) | $33,601 | $36,106 |
| Interquartile 75% (IQ3) | $47,507 | $43,454 |
| Interquartile Range (IQR) | $13,906 | $7,348 |
| Standard Deviation (Sample) | $14,141 | $5,967 |
| Standard Deviation (Population) | $14,035 | $5,947 |
Demographics Similar to Immigrants from Eritrea and Norwegians by Per Capita Income
In terms of per capita income, the demographic groups most similar to Immigrants from Eritrea are Korean ($44,522, a difference of 0.030%), Peruvian ($44,479, a difference of 0.070%), Immigrants from Armenia ($44,552, a difference of 0.10%), Scottish ($44,440, a difference of 0.16%), and Czech ($44,595, a difference of 0.19%). Similarly, the demographic groups most similar to Norwegians are Peruvian ($44,479, a difference of 0.0%), Scottish ($44,440, a difference of 0.090%), Korean ($44,522, a difference of 0.10%), Immigrants from Armenia ($44,552, a difference of 0.16%), and Czech ($44,595, a difference of 0.26%).
| Demographics | Rating | Rank | Per Capita Income |
| Immigrants | Jordan | 82.9 /100 | #140 | Excellent $45,066 |
| Slavs | 82.6 /100 | #141 | Excellent $45,049 |
| Ugandans | 82.6 /100 | #142 | Excellent $45,047 |
| Immigrants | Uganda | 82.5 /100 | #143 | Excellent $45,043 |
| Icelanders | 81.6 /100 | #144 | Excellent $44,987 |
| Immigrants | Afghanistan | 78.0 /100 | #145 | Good $44,790 |
| Irish | 75.8 /100 | #146 | Good $44,679 |
| Czechs | 74.1 /100 | #147 | Good $44,595 |
| Immigrants | Armenia | 73.1 /100 | #148 | Good $44,552 |
| Koreans | 72.5 /100 | #149 | Good $44,522 |
| Immigrants | Eritrea | 72.1 /100 | #150 | Good $44,509 |
| Norwegians | 71.5 /100 | #151 | Good $44,480 |
| Peruvians | 71.5 /100 | #152 | Good $44,479 |
| Scottish | 70.6 /100 | #153 | Good $44,440 |
| Portuguese | 68.7 /100 | #154 | Good $44,362 |
| Uruguayans | 67.6 /100 | #155 | Good $44,318 |
| Slovaks | 65.4 /100 | #156 | Good $44,229 |
| South American Indians | 64.8 /100 | #157 | Good $44,206 |
| Immigrants | Nepal | 64.3 /100 | #158 | Good $44,187 |
| South Americans | 62.4 /100 | #159 | Good $44,114 |
| Danes | 61.9 /100 | #160 | Good $44,095 |