Immigrants from Ecuador vs Immigrants from Uzbekistan Female Disability
COMPARE
Immigrants from Ecuador
Immigrants from Uzbekistan
Female Disability
Female Disability Comparison
Immigrants from Ecuador
Immigrants from Uzbekistan
11.9%
FEMALE DISABILITY
91.5/ 100
METRIC RATING
141st/ 347
METRIC RANK
12.3%
FEMALE DISABILITY
33.9/ 100
METRIC RATING
185th/ 347
METRIC RANK
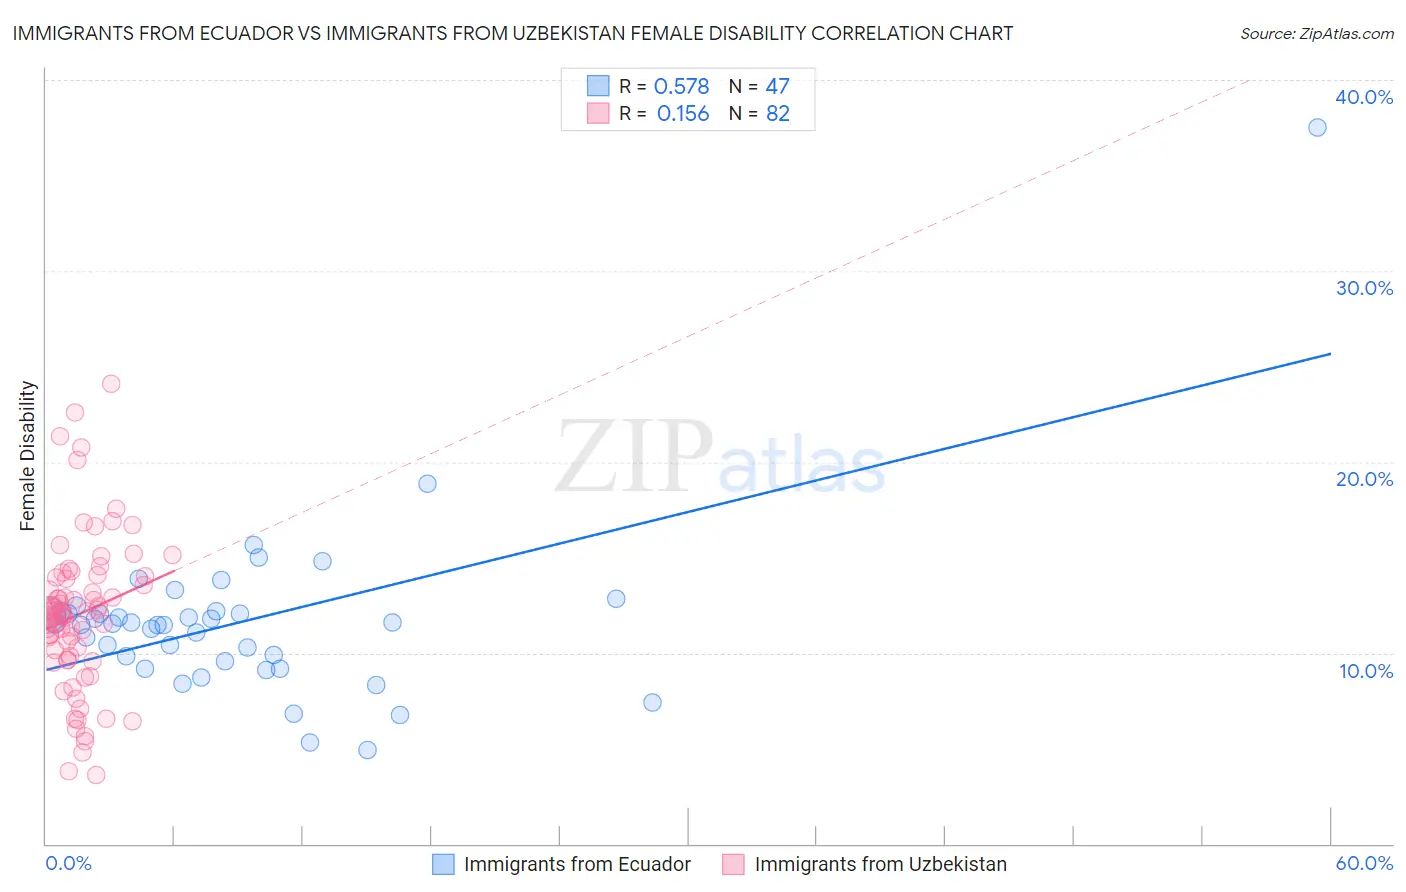
Immigrants from Ecuador vs Immigrants from Uzbekistan Female Disability Correlation Chart
The statistical analysis conducted on geographies consisting of 270,971,790 people shows a substantial positive correlation between the proportion of Immigrants from Ecuador and percentage of females with a disability in the United States with a correlation coefficient (R) of 0.578 and weighted average of 11.9%. Similarly, the statistical analysis conducted on geographies consisting of 118,753,500 people shows a poor positive correlation between the proportion of Immigrants from Uzbekistan and percentage of females with a disability in the United States with a correlation coefficient (R) of 0.156 and weighted average of 12.3%, a difference of 2.9%.
Female Disability Correlation Summary
| Measurement | Immigrants from Ecuador | Immigrants from Uzbekistan |
| Minimum | 4.9% | 3.6% |
| Maximum | 37.5% | 24.1% |
| Range | 32.6% | 20.5% |
| Mean | 11.6% | 12.0% |
| Median | 11.5% | 12.0% |
| Interquartile 25% (IQ1) | 9.5% | 9.8% |
| Interquartile 75% (IQ3) | 12.2% | 13.9% |
| Interquartile Range (IQR) | 2.6% | 4.1% |
| Standard Deviation (Sample) | 4.6% | 4.0% |
| Standard Deviation (Population) | 4.6% | 3.9% |
Similar Demographics by Female Disability
Demographics Similar to Immigrants from Ecuador by Female Disability
In terms of female disability, the demographic groups most similar to Immigrants from Ecuador are Romanian (11.9%, a difference of 0.020%), Immigrants from Africa (11.9%, a difference of 0.17%), Immigrants from Hungary (11.9%, a difference of 0.18%), Immigrants from Sudan (11.9%, a difference of 0.21%), and Ecuadorian (11.9%, a difference of 0.26%).
| Demographics | Rating | Rank | Female Disability |
| Immigrants | Nicaragua | 94.5 /100 | #134 | Exceptional 11.9% |
| Central Americans | 94.2 /100 | #135 | Exceptional 11.9% |
| Ugandans | 94.0 /100 | #136 | Exceptional 11.9% |
| Immigrants | Norway | 93.8 /100 | #137 | Exceptional 11.9% |
| Ecuadorians | 93.4 /100 | #138 | Exceptional 11.9% |
| Immigrants | Hungary | 92.8 /100 | #139 | Exceptional 11.9% |
| Romanians | 91.6 /100 | #140 | Exceptional 11.9% |
| Immigrants | Ecuador | 91.5 /100 | #141 | Exceptional 11.9% |
| Immigrants | Africa | 90.0 /100 | #142 | Excellent 11.9% |
| Immigrants | Sudan | 89.6 /100 | #143 | Excellent 11.9% |
| Immigrants | Austria | 87.9 /100 | #144 | Excellent 12.0% |
| Estonians | 87.8 /100 | #145 | Excellent 12.0% |
| Pakistanis | 84.6 /100 | #146 | Excellent 12.0% |
| Nigerians | 84.0 /100 | #147 | Excellent 12.0% |
| Immigrants | Kenya | 83.1 /100 | #148 | Excellent 12.0% |
Demographics Similar to Immigrants from Uzbekistan by Female Disability
In terms of female disability, the demographic groups most similar to Immigrants from Uzbekistan are Austrian (12.3%, a difference of 0.020%), Serbian (12.3%, a difference of 0.030%), Immigrants from North America (12.3%, a difference of 0.050%), Iraqi (12.3%, a difference of 0.080%), and Cuban (12.3%, a difference of 0.10%).
| Demographics | Rating | Rank | Female Disability |
| Immigrants | Western Europe | 40.9 /100 | #178 | Average 12.2% |
| Immigrants | Fiji | 38.2 /100 | #179 | Fair 12.3% |
| Albanians | 37.9 /100 | #180 | Fair 12.3% |
| Immigrants | Canada | 37.2 /100 | #181 | Fair 12.3% |
| Norwegians | 36.9 /100 | #182 | Fair 12.3% |
| Cubans | 36.5 /100 | #183 | Fair 12.3% |
| Iraqis | 36.0 /100 | #184 | Fair 12.3% |
| Immigrants | Uzbekistan | 33.9 /100 | #185 | Fair 12.3% |
| Austrians | 33.3 /100 | #186 | Fair 12.3% |
| Serbians | 33.1 /100 | #187 | Fair 12.3% |
| Immigrants | North America | 32.8 /100 | #188 | Fair 12.3% |
| Immigrants | Albania | 31.6 /100 | #189 | Fair 12.3% |
| Immigrants | Honduras | 31.3 /100 | #190 | Fair 12.3% |
| Armenians | 29.7 /100 | #191 | Fair 12.3% |
| Immigrants | Western Africa | 29.2 /100 | #192 | Fair 12.3% |