Immigrants from Somalia vs Immigrants from Nepal Disability Age Over 75
COMPARE
Immigrants from Somalia
Immigrants from Nepal
Disability Age Over 75
Disability Age Over 75 Comparison
Immigrants from Somalia
Immigrants from Nepal
47.7%
DISABILITY AGE OVER 75
21.4/ 100
METRIC RATING
200th/ 347
METRIC RANK
46.6%
DISABILITY AGE OVER 75
94.1/ 100
METRIC RATING
120th/ 347
METRIC RANK
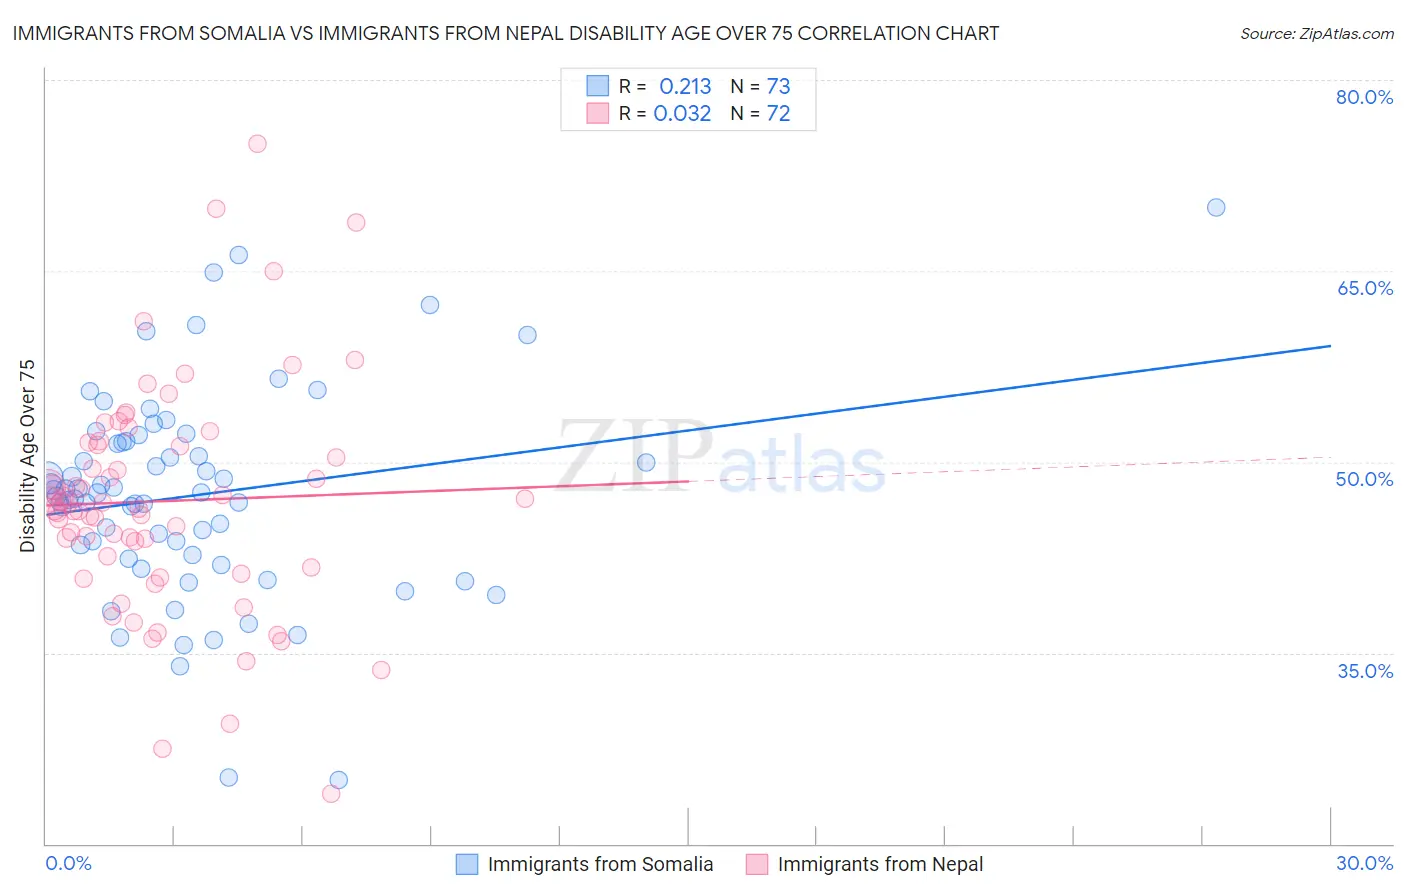
Immigrants from Somalia vs Immigrants from Nepal Disability Age Over 75 Correlation Chart
The statistical analysis conducted on geographies consisting of 92,093,367 people shows a weak positive correlation between the proportion of Immigrants from Somalia and percentage of population with a disability over the age of 75 in the United States with a correlation coefficient (R) of 0.213 and weighted average of 47.7%. Similarly, the statistical analysis conducted on geographies consisting of 186,573,944 people shows no correlation between the proportion of Immigrants from Nepal and percentage of population with a disability over the age of 75 in the United States with a correlation coefficient (R) of 0.032 and weighted average of 46.6%, a difference of 2.3%.
Disability Age Over 75 Correlation Summary
| Measurement | Immigrants from Somalia | Immigrants from Nepal |
| Minimum | 25.0% | 24.0% |
| Maximum | 69.9% | 75.0% |
| Range | 44.9% | 51.0% |
| Mean | 47.4% | 46.9% |
| Median | 47.6% | 46.5% |
| Interquartile 25% (IQ1) | 42.6% | 42.1% |
| Interquartile 75% (IQ3) | 51.6% | 51.4% |
| Interquartile Range (IQR) | 9.0% | 9.3% |
| Standard Deviation (Sample) | 8.2% | 9.0% |
| Standard Deviation (Population) | 8.2% | 8.9% |
Similar Demographics by Disability Age Over 75
Demographics Similar to Immigrants from Somalia by Disability Age Over 75
In terms of disability age over 75, the demographic groups most similar to Immigrants from Somalia are Immigrants from Cuba (47.7%, a difference of 0.020%), Immigrants from Bahamas (47.7%, a difference of 0.020%), Immigrants from Eritrea (47.7%, a difference of 0.030%), Trinidadian and Tobagonian (47.7%, a difference of 0.050%), and Immigrants from Ukraine (47.7%, a difference of 0.060%).
| Demographics | Rating | Rank | Disability Age Over 75 |
| Ottawa | 28.1 /100 | #193 | Fair 47.6% |
| Immigrants | Lebanon | 26.5 /100 | #194 | Fair 47.6% |
| Immigrants | Trinidad and Tobago | 25.3 /100 | #195 | Fair 47.6% |
| Immigrants | Portugal | 23.8 /100 | #196 | Fair 47.6% |
| Pakistanis | 23.4 /100 | #197 | Fair 47.7% |
| Immigrants | Ukraine | 23.2 /100 | #198 | Fair 47.7% |
| Immigrants | Eritrea | 22.4 /100 | #199 | Fair 47.7% |
| Immigrants | Somalia | 21.4 /100 | #200 | Fair 47.7% |
| Immigrants | Cuba | 20.9 /100 | #201 | Fair 47.7% |
| Immigrants | Bahamas | 20.7 /100 | #202 | Fair 47.7% |
| Trinidadians and Tobagonians | 20.0 /100 | #203 | Fair 47.7% |
| Nigerians | 19.2 /100 | #204 | Poor 47.7% |
| Immigrants | Ghana | 19.1 /100 | #205 | Poor 47.7% |
| Jamaicans | 19.0 /100 | #206 | Poor 47.7% |
| Immigrants | Syria | 17.4 /100 | #207 | Poor 47.8% |
Demographics Similar to Immigrants from Nepal by Disability Age Over 75
In terms of disability age over 75, the demographic groups most similar to Immigrants from Nepal are Canadian (46.6%, a difference of 0.030%), Scandinavian (46.6%, a difference of 0.050%), Czechoslovakian (46.6%, a difference of 0.060%), Immigrants from Albania (46.6%, a difference of 0.090%), and Hungarian (46.5%, a difference of 0.14%).
| Demographics | Rating | Rank | Disability Age Over 75 |
| Irish | 96.0 /100 | #113 | Exceptional 46.5% |
| Dutch | 95.9 /100 | #114 | Exceptional 46.5% |
| British | 95.7 /100 | #115 | Exceptional 46.5% |
| Indians (Asian) | 95.7 /100 | #116 | Exceptional 46.5% |
| Hungarians | 95.3 /100 | #117 | Exceptional 46.5% |
| Czechoslovakians | 94.7 /100 | #118 | Exceptional 46.6% |
| Canadians | 94.4 /100 | #119 | Exceptional 46.6% |
| Immigrants | Nepal | 94.1 /100 | #120 | Exceptional 46.6% |
| Scandinavians | 93.6 /100 | #121 | Exceptional 46.6% |
| Immigrants | Albania | 93.2 /100 | #122 | Exceptional 46.6% |
| Immigrants | Colombia | 92.6 /100 | #123 | Exceptional 46.7% |
| Immigrants | South America | 91.8 /100 | #124 | Exceptional 46.7% |
| Colombians | 91.3 /100 | #125 | Exceptional 46.7% |
| Europeans | 91.2 /100 | #126 | Exceptional 46.7% |
| Syrians | 91.1 /100 | #127 | Exceptional 46.7% |