Immigrants from Eastern Europe vs Osage Disability Age Over 75
COMPARE
Immigrants from Eastern Europe
Osage
Disability Age Over 75
Disability Age Over 75 Comparison
Immigrants from Eastern Europe
Osage
46.3%
DISABILITY AGE OVER 75
97.7/ 100
METRIC RATING
100th/ 347
METRIC RANK
49.8%
DISABILITY AGE OVER 75
0.0/ 100
METRIC RATING
289th/ 347
METRIC RANK
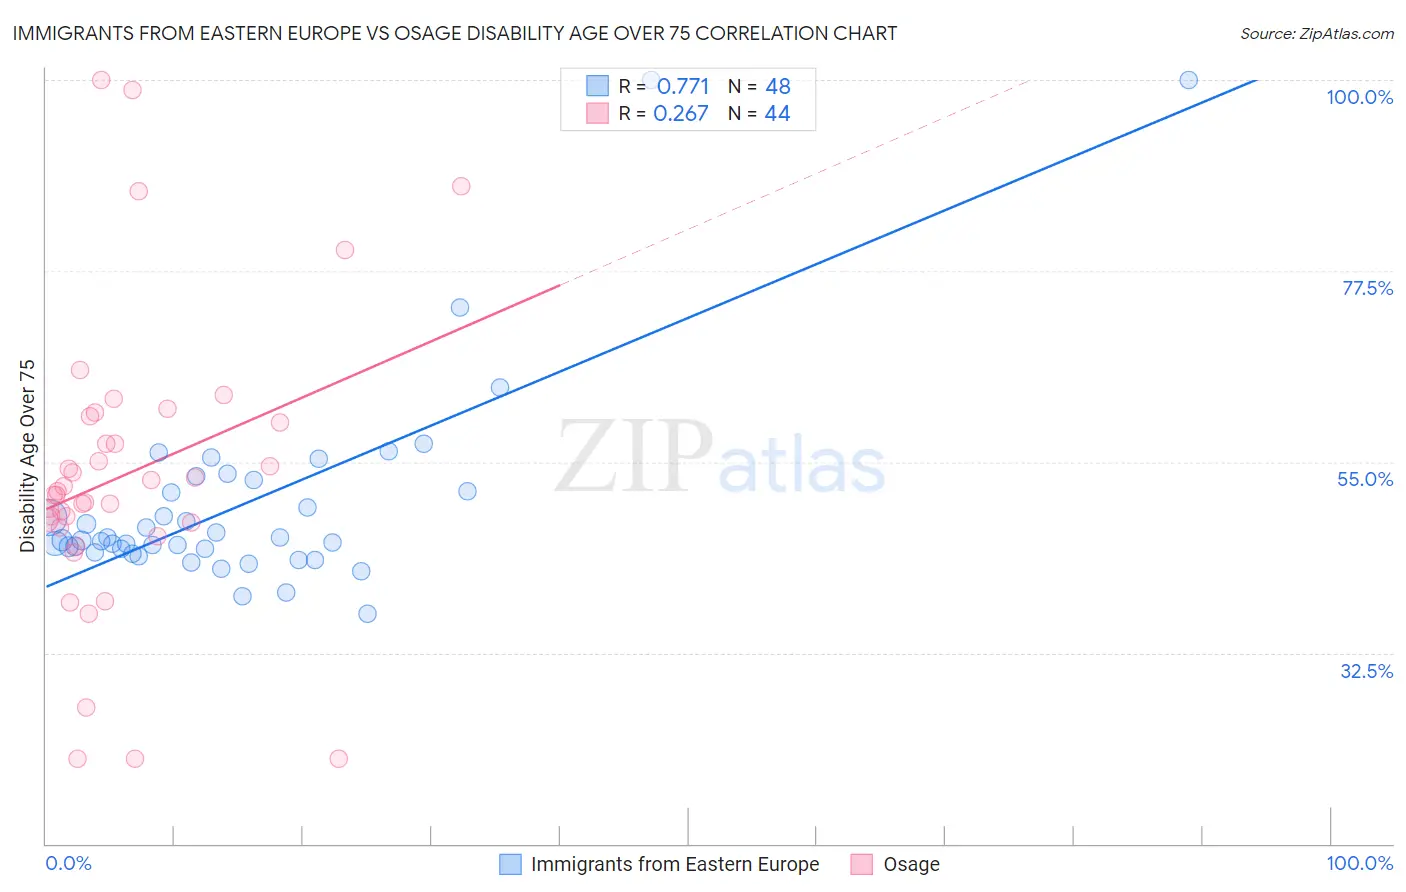
Immigrants from Eastern Europe vs Osage Disability Age Over 75 Correlation Chart
The statistical analysis conducted on geographies consisting of 474,726,991 people shows a strong positive correlation between the proportion of Immigrants from Eastern Europe and percentage of population with a disability over the age of 75 in the United States with a correlation coefficient (R) of 0.771 and weighted average of 46.3%. Similarly, the statistical analysis conducted on geographies consisting of 91,764,499 people shows a weak positive correlation between the proportion of Osage and percentage of population with a disability over the age of 75 in the United States with a correlation coefficient (R) of 0.267 and weighted average of 49.8%, a difference of 7.5%.
Disability Age Over 75 Correlation Summary
| Measurement | Immigrants from Eastern Europe | Osage |
| Minimum | 37.1% | 20.0% |
| Maximum | 100.0% | 100.0% |
| Range | 62.9% | 80.0% |
| Mean | 50.1% | 53.5% |
| Median | 45.7% | 51.3% |
| Interquartile 25% (IQ1) | 44.6% | 47.6% |
| Interquartile 75% (IQ3) | 52.1% | 60.1% |
| Interquartile Range (IQR) | 7.6% | 12.5% |
| Standard Deviation (Sample) | 12.3% | 17.4% |
| Standard Deviation (Population) | 12.2% | 17.2% |
Similar Demographics by Disability Age Over 75
Demographics Similar to Immigrants from Eastern Europe by Disability Age Over 75
In terms of disability age over 75, the demographic groups most similar to Immigrants from Eastern Europe are Palestinian (46.3%, a difference of 0.0%), Mongolian (46.3%, a difference of 0.0%), Immigrants from Japan (46.3%, a difference of 0.040%), Finnish (46.3%, a difference of 0.050%), and Immigrants from Brazil (46.3%, a difference of 0.080%).
| Demographics | Rating | Rank | Disability Age Over 75 |
| Ugandans | 98.2 /100 | #93 | Exceptional 46.3% |
| Albanians | 98.1 /100 | #94 | Exceptional 46.3% |
| Immigrants | Brazil | 98.0 /100 | #95 | Exceptional 46.3% |
| Immigrants | China | 98.0 /100 | #96 | Exceptional 46.3% |
| Finns | 97.9 /100 | #97 | Exceptional 46.3% |
| Immigrants | Japan | 97.8 /100 | #98 | Exceptional 46.3% |
| Palestinians | 97.7 /100 | #99 | Exceptional 46.3% |
| Immigrants | Eastern Europe | 97.7 /100 | #100 | Exceptional 46.3% |
| Mongolians | 97.7 /100 | #101 | Exceptional 46.3% |
| Immigrants | Malaysia | 97.1 /100 | #102 | Exceptional 46.4% |
| Ukrainians | 97.1 /100 | #103 | Exceptional 46.4% |
| Israelis | 97.0 /100 | #104 | Exceptional 46.4% |
| Immigrants | Cameroon | 96.9 /100 | #105 | Exceptional 46.4% |
| Immigrants | Kuwait | 96.8 /100 | #106 | Exceptional 46.4% |
| Immigrants | Uruguay | 96.7 /100 | #107 | Exceptional 46.4% |
Demographics Similar to Osage by Disability Age Over 75
In terms of disability age over 75, the demographic groups most similar to Osage are Puget Sound Salish (49.8%, a difference of 0.010%), Arapaho (49.8%, a difference of 0.020%), Yaqui (49.8%, a difference of 0.080%), Shoshone (49.9%, a difference of 0.090%), and Sioux (49.7%, a difference of 0.13%).
| Demographics | Rating | Rank | Disability Age Over 75 |
| Blacks/African Americans | 0.0 /100 | #282 | Tragic 49.5% |
| Samoans | 0.0 /100 | #283 | Tragic 49.5% |
| Immigrants | Latin America | 0.0 /100 | #284 | Tragic 49.5% |
| Crow | 0.0 /100 | #285 | Tragic 49.6% |
| Immigrants | Belize | 0.0 /100 | #286 | Tragic 49.6% |
| Sioux | 0.0 /100 | #287 | Tragic 49.7% |
| Yaqui | 0.0 /100 | #288 | Tragic 49.8% |
| Osage | 0.0 /100 | #289 | Tragic 49.8% |
| Puget Sound Salish | 0.0 /100 | #290 | Tragic 49.8% |
| Arapaho | 0.0 /100 | #291 | Tragic 49.8% |
| Shoshone | 0.0 /100 | #292 | Tragic 49.9% |
| Spanish American Indians | 0.0 /100 | #293 | Tragic 49.9% |
| Immigrants | Cambodia | 0.0 /100 | #294 | Tragic 50.0% |
| Spanish Americans | 0.0 /100 | #295 | Tragic 50.0% |
| Mexican American Indians | 0.0 /100 | #296 | Tragic 50.0% |