Immigrants from Eastern Africa vs Immigrants from Israel Disability Age Over 75
COMPARE
Immigrants from Eastern Africa
Immigrants from Israel
Disability Age Over 75
Disability Age Over 75 Comparison
Immigrants from Eastern Africa
Immigrants from Israel
47.2%
DISABILITY AGE OVER 75
65.5/ 100
METRIC RATING
163rd/ 347
METRIC RANK
45.9%
DISABILITY AGE OVER 75
99.6/ 100
METRIC RATING
58th/ 347
METRIC RANK
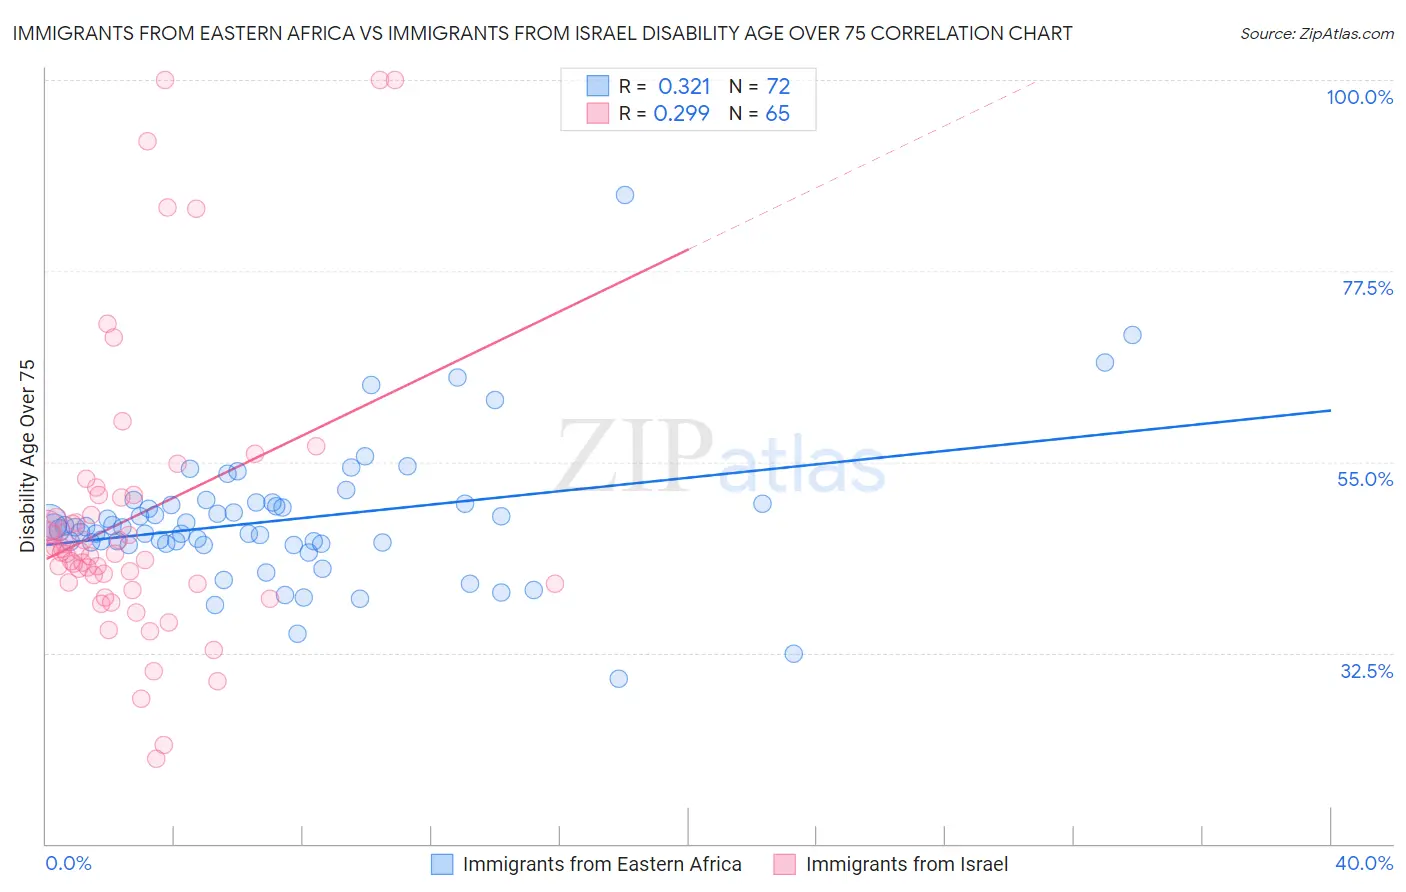
Immigrants from Eastern Africa vs Immigrants from Israel Disability Age Over 75 Correlation Chart
The statistical analysis conducted on geographies consisting of 354,505,709 people shows a mild positive correlation between the proportion of Immigrants from Eastern Africa and percentage of population with a disability over the age of 75 in the United States with a correlation coefficient (R) of 0.321 and weighted average of 47.2%. Similarly, the statistical analysis conducted on geographies consisting of 209,886,024 people shows a weak positive correlation between the proportion of Immigrants from Israel and percentage of population with a disability over the age of 75 in the United States with a correlation coefficient (R) of 0.299 and weighted average of 45.9%, a difference of 2.8%.
Disability Age Over 75 Correlation Summary
| Measurement | Immigrants from Eastern Africa | Immigrants from Israel |
| Minimum | 29.5% | 20.0% |
| Maximum | 86.5% | 100.0% |
| Range | 57.0% | 80.0% |
| Mean | 48.2% | 48.5% |
| Median | 47.2% | 44.4% |
| Interquartile 25% (IQ1) | 45.3% | 40.6% |
| Interquartile 75% (IQ3) | 50.0% | 50.9% |
| Interquartile Range (IQR) | 4.7% | 10.3% |
| Standard Deviation (Sample) | 8.3% | 17.1% |
| Standard Deviation (Population) | 8.2% | 16.9% |
Similar Demographics by Disability Age Over 75
Demographics Similar to Immigrants from Eastern Africa by Disability Age Over 75
In terms of disability age over 75, the demographic groups most similar to Immigrants from Eastern Africa are Pennsylvania German (47.2%, a difference of 0.010%), French (47.2%, a difference of 0.020%), Immigrants from Zimbabwe (47.2%, a difference of 0.030%), Immigrants from Sierra Leone (47.2%, a difference of 0.030%), and Immigrants from Middle Africa (47.1%, a difference of 0.070%).
| Demographics | Rating | Rank | Disability Age Over 75 |
| Arabs | 73.3 /100 | #156 | Good 47.1% |
| Bhutanese | 72.6 /100 | #157 | Good 47.1% |
| Immigrants | Guyana | 71.9 /100 | #158 | Good 47.1% |
| Immigrants | Morocco | 71.4 /100 | #159 | Good 47.1% |
| Immigrants | Middle Africa | 68.3 /100 | #160 | Good 47.1% |
| South American Indians | 68.1 /100 | #161 | Good 47.1% |
| Pennsylvania Germans | 66.0 /100 | #162 | Good 47.2% |
| Immigrants | Eastern Africa | 65.5 /100 | #163 | Good 47.2% |
| French | 64.6 /100 | #164 | Good 47.2% |
| Immigrants | Zimbabwe | 64.4 /100 | #165 | Good 47.2% |
| Immigrants | Sierra Leone | 64.4 /100 | #166 | Good 47.2% |
| Moroccans | 62.9 /100 | #167 | Good 47.2% |
| Kenyans | 58.8 /100 | #168 | Average 47.2% |
| Celtics | 58.7 /100 | #169 | Average 47.2% |
| German Russians | 56.2 /100 | #170 | Average 47.3% |
Demographics Similar to Immigrants from Israel by Disability Age Over 75
In terms of disability age over 75, the demographic groups most similar to Immigrants from Israel are Immigrants from Turkey (45.9%, a difference of 0.0%), Iranian (45.9%, a difference of 0.010%), Immigrants from Europe (45.9%, a difference of 0.010%), Immigrants from Netherlands (45.9%, a difference of 0.020%), and Immigrants from Argentina (45.9%, a difference of 0.030%).
| Demographics | Rating | Rank | Disability Age Over 75 |
| Immigrants | Korea | 99.7 /100 | #51 | Exceptional 45.8% |
| Immigrants | France | 99.7 /100 | #52 | Exceptional 45.8% |
| Immigrants | Italy | 99.7 /100 | #53 | Exceptional 45.8% |
| Slovaks | 99.6 /100 | #54 | Exceptional 45.8% |
| Maltese | 99.6 /100 | #55 | Exceptional 45.8% |
| Immigrants | Netherlands | 99.6 /100 | #56 | Exceptional 45.9% |
| Immigrants | Turkey | 99.6 /100 | #57 | Exceptional 45.9% |
| Immigrants | Israel | 99.6 /100 | #58 | Exceptional 45.9% |
| Iranians | 99.6 /100 | #59 | Exceptional 45.9% |
| Immigrants | Europe | 99.6 /100 | #60 | Exceptional 45.9% |
| Immigrants | Argentina | 99.6 /100 | #61 | Exceptional 45.9% |
| Burmese | 99.5 /100 | #62 | Exceptional 45.9% |
| Immigrants | Norway | 99.5 /100 | #63 | Exceptional 45.9% |
| Immigrants | North Macedonia | 99.5 /100 | #64 | Exceptional 45.9% |
| Austrians | 99.5 /100 | #65 | Exceptional 46.0% |