Immigrants from Dominican Republic vs Romanian Vision Disability
COMPARE
Immigrants from Dominican Republic
Romanian
Vision Disability
Vision Disability Comparison
Immigrants from Dominican Republic
Romanians
2.6%
VISION DISABILITY
0.0/ 100
METRIC RATING
307th/ 347
METRIC RANK
2.1%
VISION DISABILITY
95.7/ 100
METRIC RATING
96th/ 347
METRIC RANK
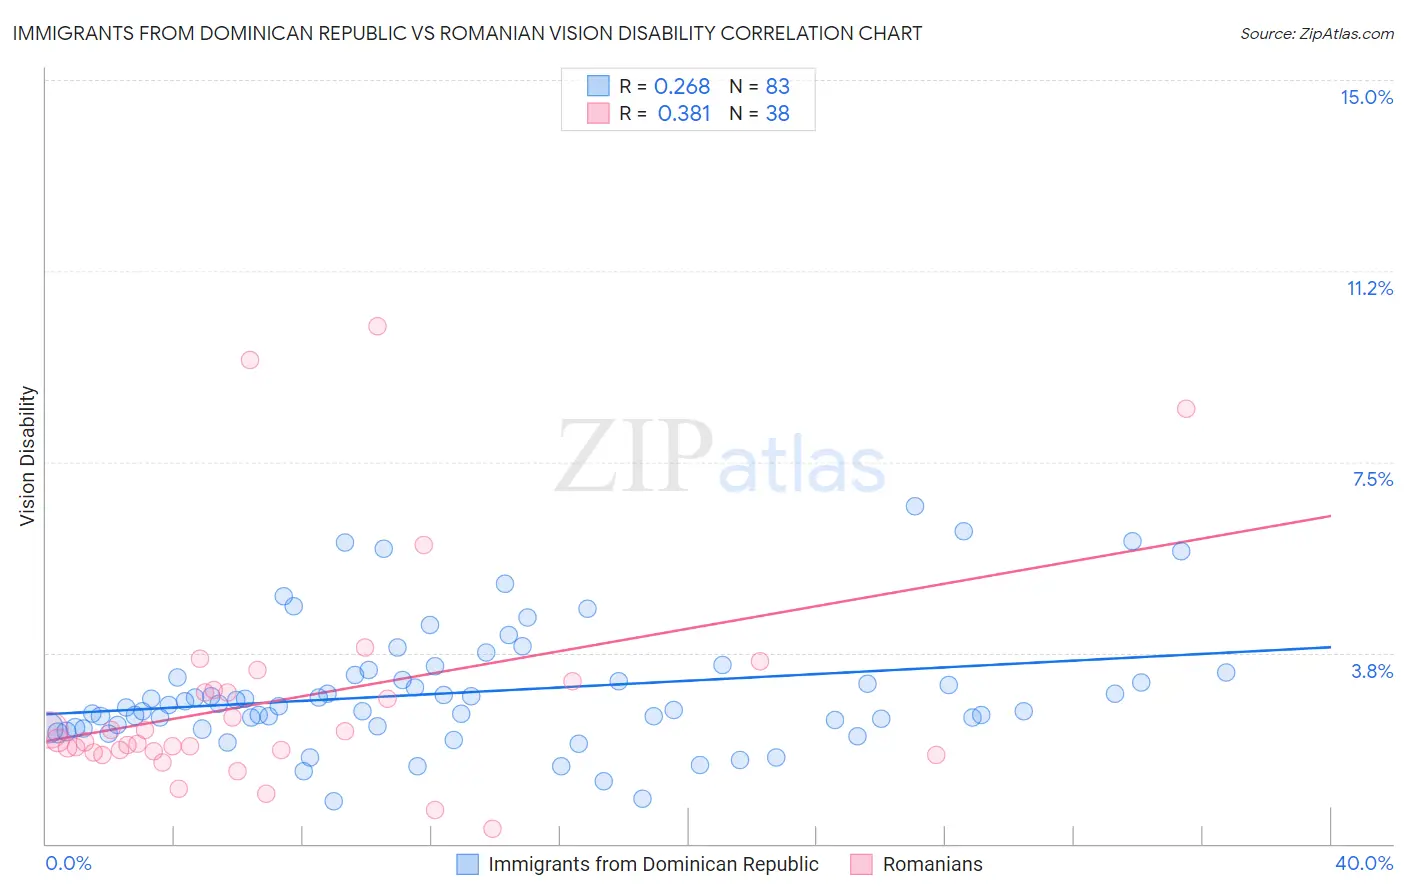
Immigrants from Dominican Republic vs Romanian Vision Disability Correlation Chart
The statistical analysis conducted on geographies consisting of 274,988,247 people shows a weak positive correlation between the proportion of Immigrants from Dominican Republic and percentage of population with vision disability in the United States with a correlation coefficient (R) of 0.268 and weighted average of 2.6%. Similarly, the statistical analysis conducted on geographies consisting of 377,620,863 people shows a mild positive correlation between the proportion of Romanians and percentage of population with vision disability in the United States with a correlation coefficient (R) of 0.381 and weighted average of 2.1%, a difference of 26.6%.
Vision Disability Correlation Summary
| Measurement | Immigrants from Dominican Republic | Romanian |
| Minimum | 0.84% | 0.28% |
| Maximum | 6.6% | 10.2% |
| Range | 5.8% | 9.9% |
| Mean | 3.0% | 2.8% |
| Median | 2.7% | 2.0% |
| Interquartile 25% (IQ1) | 2.3% | 1.8% |
| Interquartile 75% (IQ3) | 3.3% | 3.0% |
| Interquartile Range (IQR) | 1.0% | 1.2% |
| Standard Deviation (Sample) | 1.2% | 2.2% |
| Standard Deviation (Population) | 1.2% | 2.2% |
Similar Demographics by Vision Disability
Demographics Similar to Immigrants from Dominican Republic by Vision Disability
In terms of vision disability, the demographic groups most similar to Immigrants from Dominican Republic are Iroquois (2.6%, a difference of 0.020%), Arapaho (2.6%, a difference of 0.020%), Immigrants from Yemen (2.6%, a difference of 0.30%), Blackfeet (2.6%, a difference of 0.63%), and Hispanic or Latino (2.6%, a difference of 0.64%).
| Demographics | Rating | Rank | Vision Disability |
| Africans | 0.0 /100 | #300 | Tragic 2.5% |
| Menominee | 0.0 /100 | #301 | Tragic 2.5% |
| Spanish American Indians | 0.0 /100 | #302 | Tragic 2.6% |
| Immigrants | Cabo Verde | 0.0 /100 | #303 | Tragic 2.6% |
| Aleuts | 0.0 /100 | #304 | Tragic 2.6% |
| Hispanics or Latinos | 0.0 /100 | #305 | Tragic 2.6% |
| Iroquois | 0.0 /100 | #306 | Tragic 2.6% |
| Immigrants | Dominican Republic | 0.0 /100 | #307 | Tragic 2.6% |
| Arapaho | 0.0 /100 | #308 | Tragic 2.6% |
| Immigrants | Yemen | 0.0 /100 | #309 | Tragic 2.6% |
| Blackfeet | 0.0 /100 | #310 | Tragic 2.6% |
| Dominicans | 0.0 /100 | #311 | Tragic 2.6% |
| Americans | 0.0 /100 | #312 | Tragic 2.6% |
| Potawatomi | 0.0 /100 | #313 | Tragic 2.6% |
| Inupiat | 0.0 /100 | #314 | Tragic 2.7% |
Demographics Similar to Romanians by Vision Disability
In terms of vision disability, the demographic groups most similar to Romanians are Australian (2.1%, a difference of 0.060%), Immigrants from Afghanistan (2.1%, a difference of 0.070%), Immigrants from South Africa (2.1%, a difference of 0.11%), Immigrants from Croatia (2.1%, a difference of 0.13%), and Immigrants from Europe (2.1%, a difference of 0.15%).
| Demographics | Rating | Rank | Vision Disability |
| Immigrants | Eastern Africa | 97.0 /100 | #89 | Exceptional 2.0% |
| Immigrants | Lebanon | 96.7 /100 | #90 | Exceptional 2.1% |
| Immigrants | Somalia | 96.2 /100 | #91 | Exceptional 2.1% |
| Immigrants | Syria | 96.2 /100 | #92 | Exceptional 2.1% |
| Immigrants | Europe | 96.1 /100 | #93 | Exceptional 2.1% |
| Immigrants | Croatia | 96.0 /100 | #94 | Exceptional 2.1% |
| Australians | 95.9 /100 | #95 | Exceptional 2.1% |
| Romanians | 95.7 /100 | #96 | Exceptional 2.1% |
| Immigrants | Afghanistan | 95.6 /100 | #97 | Exceptional 2.1% |
| Immigrants | South Africa | 95.4 /100 | #98 | Exceptional 2.1% |
| Estonians | 95.3 /100 | #99 | Exceptional 2.1% |
| Greeks | 95.1 /100 | #100 | Exceptional 2.1% |
| Albanians | 94.9 /100 | #101 | Exceptional 2.1% |
| Sri Lankans | 94.8 /100 | #102 | Exceptional 2.1% |
| Immigrants | Austria | 94.4 /100 | #103 | Exceptional 2.1% |