Immigrants from Dominican Republic vs French American Indian Vision Disability
COMPARE
Immigrants from Dominican Republic
French American Indian
Vision Disability
Vision Disability Comparison
Immigrants from Dominican Republic
French American Indians
2.6%
VISION DISABILITY
0.0/ 100
METRIC RATING
307th/ 347
METRIC RANK
2.5%
VISION DISABILITY
0.0/ 100
METRIC RATING
288th/ 347
METRIC RANK
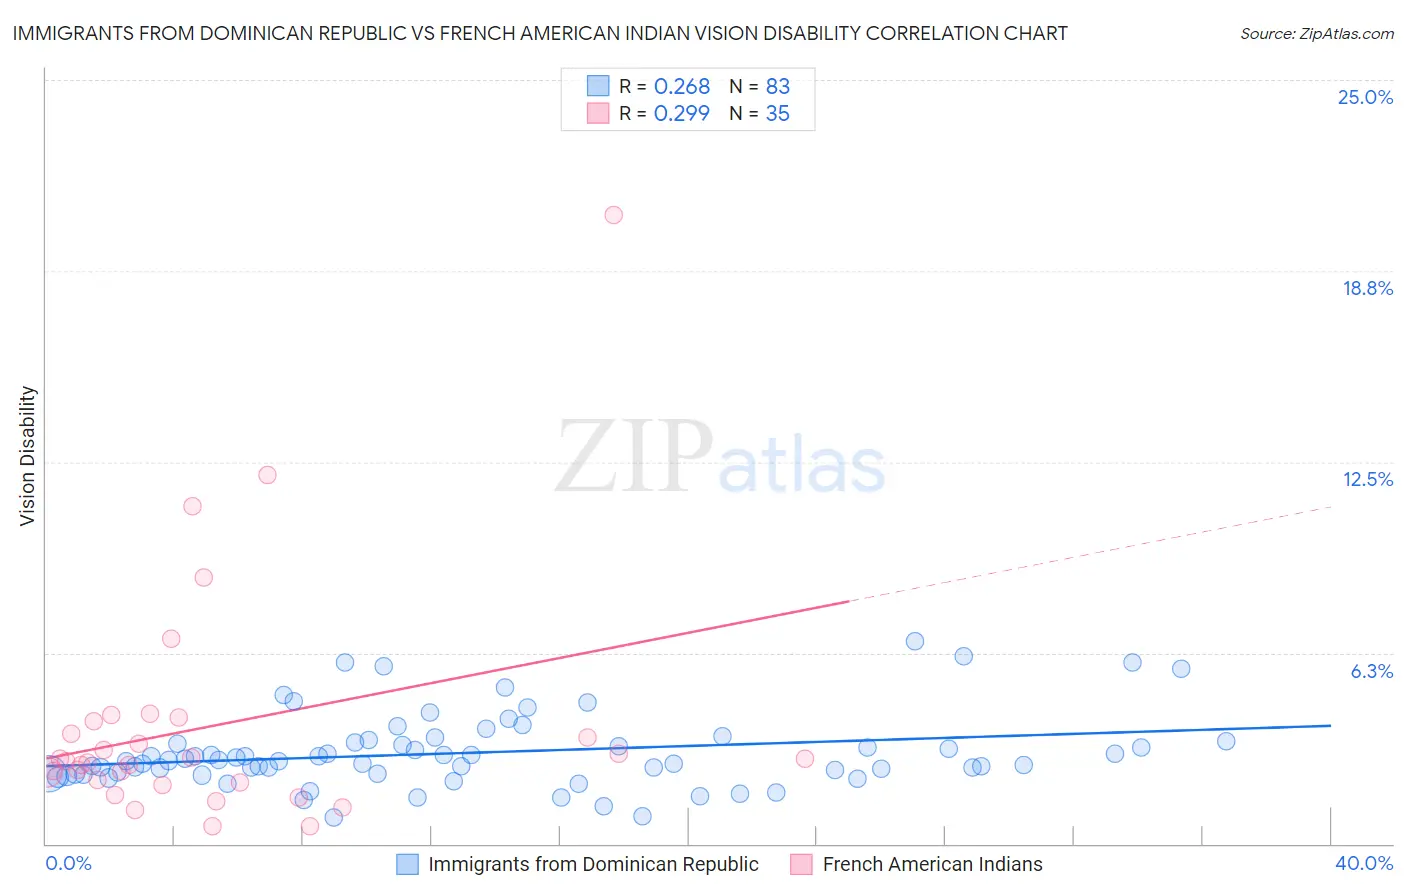
Immigrants from Dominican Republic vs French American Indian Vision Disability Correlation Chart
The statistical analysis conducted on geographies consisting of 274,988,247 people shows a weak positive correlation between the proportion of Immigrants from Dominican Republic and percentage of population with vision disability in the United States with a correlation coefficient (R) of 0.268 and weighted average of 2.6%. Similarly, the statistical analysis conducted on geographies consisting of 131,938,190 people shows a weak positive correlation between the proportion of French American Indians and percentage of population with vision disability in the United States with a correlation coefficient (R) of 0.299 and weighted average of 2.5%, a difference of 5.6%.
Vision Disability Correlation Summary
| Measurement | Immigrants from Dominican Republic | French American Indian |
| Minimum | 0.84% | 0.57% |
| Maximum | 6.6% | 20.6% |
| Range | 5.8% | 20.0% |
| Mean | 3.0% | 3.8% |
| Median | 2.7% | 2.7% |
| Interquartile 25% (IQ1) | 2.3% | 2.0% |
| Interquartile 75% (IQ3) | 3.3% | 4.0% |
| Interquartile Range (IQR) | 1.0% | 2.0% |
| Standard Deviation (Sample) | 1.2% | 3.9% |
| Standard Deviation (Population) | 1.2% | 3.8% |
Demographics Similar to Immigrants from Dominican Republic and French American Indians by Vision Disability
In terms of vision disability, the demographic groups most similar to Immigrants from Dominican Republic are Iroquois (2.6%, a difference of 0.020%), Hispanic or Latino (2.6%, a difference of 0.64%), Aleut (2.6%, a difference of 0.94%), Immigrants from Cabo Verde (2.6%, a difference of 1.1%), and Spanish American Indian (2.6%, a difference of 1.3%). Similarly, the demographic groups most similar to French American Indians are Honduran (2.5%, a difference of 0.020%), Nonimmigrants (2.5%, a difference of 0.41%), Immigrants from Cuba (2.5%, a difference of 0.55%), Immigrants from Honduras (2.5%, a difference of 0.94%), and Crow (2.5%, a difference of 1.0%).
| Demographics | Rating | Rank | Vision Disability |
| Hondurans | 0.0 /100 | #287 | Tragic 2.5% |
| French American Indians | 0.0 /100 | #288 | Tragic 2.5% |
| Immigrants | Nonimmigrants | 0.0 /100 | #289 | Tragic 2.5% |
| Immigrants | Cuba | 0.0 /100 | #290 | Tragic 2.5% |
| Immigrants | Honduras | 0.0 /100 | #291 | Tragic 2.5% |
| Crow | 0.0 /100 | #292 | Tragic 2.5% |
| Yaqui | 0.0 /100 | #293 | Tragic 2.5% |
| Ottawa | 0.0 /100 | #294 | Tragic 2.5% |
| Delaware | 0.0 /100 | #295 | Tragic 2.5% |
| Immigrants | Mexico | 0.0 /100 | #296 | Tragic 2.5% |
| Immigrants | Dominica | 0.0 /100 | #297 | Tragic 2.5% |
| Mexicans | 0.0 /100 | #298 | Tragic 2.5% |
| Cree | 0.0 /100 | #299 | Tragic 2.5% |
| Africans | 0.0 /100 | #300 | Tragic 2.5% |
| Menominee | 0.0 /100 | #301 | Tragic 2.5% |
| Spanish American Indians | 0.0 /100 | #302 | Tragic 2.6% |
| Immigrants | Cabo Verde | 0.0 /100 | #303 | Tragic 2.6% |
| Aleuts | 0.0 /100 | #304 | Tragic 2.6% |
| Hispanics or Latinos | 0.0 /100 | #305 | Tragic 2.6% |
| Iroquois | 0.0 /100 | #306 | Tragic 2.6% |
| Immigrants | Dominican Republic | 0.0 /100 | #307 | Tragic 2.6% |