Immigrants from Dominican Republic vs Puerto Rican Disability Age Over 75
COMPARE
Immigrants from Dominican Republic
Puerto Rican
Disability Age Over 75
Disability Age Over 75 Comparison
Immigrants from Dominican Republic
Puerto Ricans
50.3%
DISABILITY AGE OVER 75
0.0/ 100
METRIC RATING
304th/ 347
METRIC RANK
52.9%
DISABILITY AGE OVER 75
0.0/ 100
METRIC RATING
330th/ 347
METRIC RANK
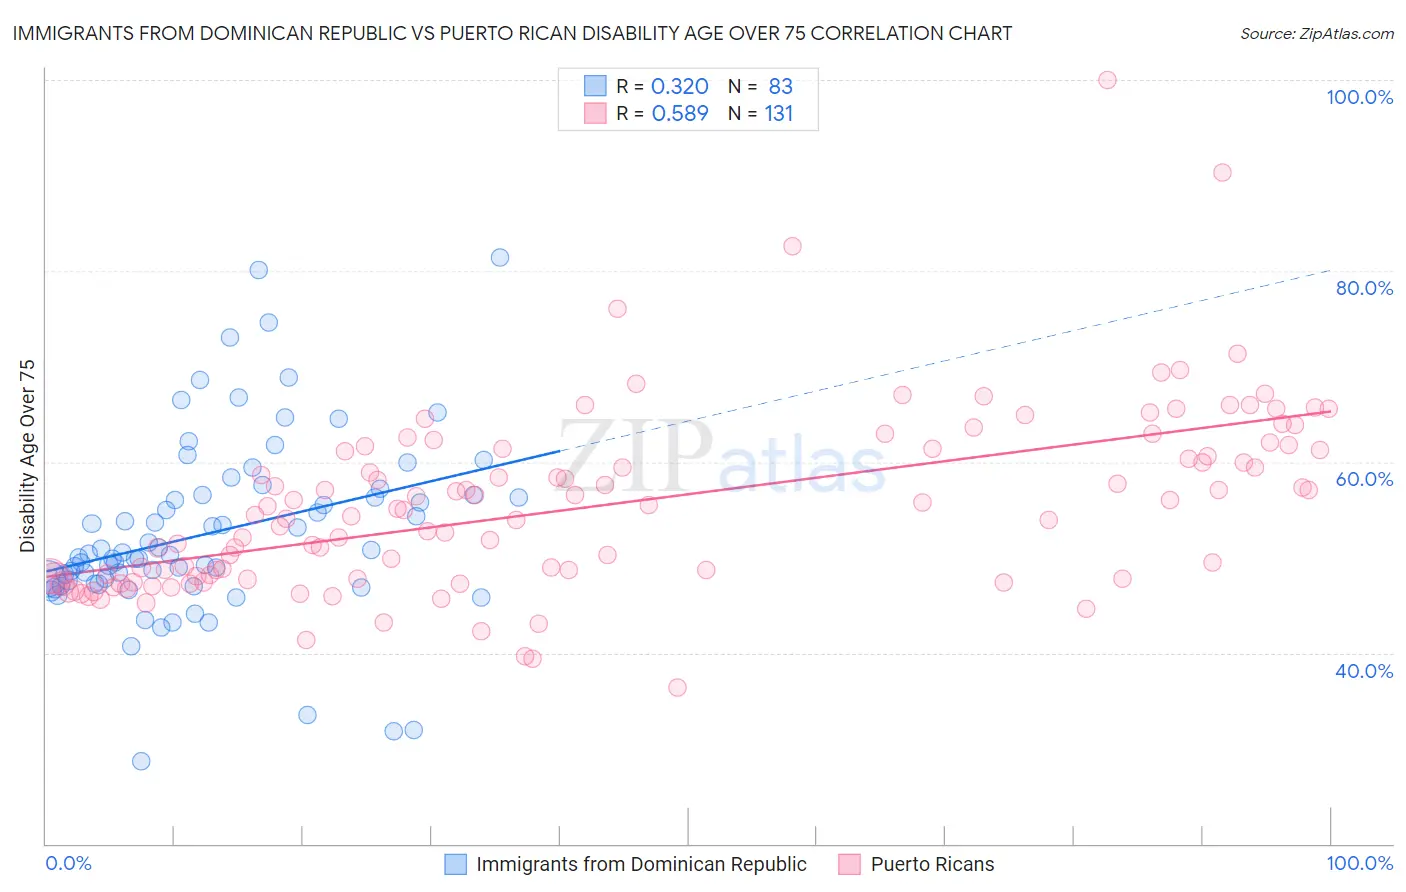
Immigrants from Dominican Republic vs Puerto Rican Disability Age Over 75 Correlation Chart
The statistical analysis conducted on geographies consisting of 274,580,835 people shows a mild positive correlation between the proportion of Immigrants from Dominican Republic and percentage of population with a disability over the age of 75 in the United States with a correlation coefficient (R) of 0.320 and weighted average of 50.3%. Similarly, the statistical analysis conducted on geographies consisting of 526,593,601 people shows a substantial positive correlation between the proportion of Puerto Ricans and percentage of population with a disability over the age of 75 in the United States with a correlation coefficient (R) of 0.589 and weighted average of 52.9%, a difference of 5.2%.
Disability Age Over 75 Correlation Summary
| Measurement | Immigrants from Dominican Republic | Puerto Rican |
| Minimum | 28.7% | 36.4% |
| Maximum | 81.4% | 100.0% |
| Range | 52.8% | 63.6% |
| Mean | 52.6% | 55.4% |
| Median | 50.4% | 54.9% |
| Interquartile 25% (IQ1) | 47.3% | 47.8% |
| Interquartile 75% (IQ3) | 56.6% | 61.4% |
| Interquartile Range (IQR) | 9.3% | 13.6% |
| Standard Deviation (Sample) | 9.6% | 9.6% |
| Standard Deviation (Population) | 9.5% | 9.5% |
Similar Demographics by Disability Age Over 75
Demographics Similar to Immigrants from Dominican Republic by Disability Age Over 75
In terms of disability age over 75, the demographic groups most similar to Immigrants from Dominican Republic are Japanese (50.2%, a difference of 0.11%), Cherokee (50.2%, a difference of 0.12%), Dominican (50.2%, a difference of 0.28%), Cape Verdean (50.1%, a difference of 0.34%), and Immigrants from Micronesia (50.1%, a difference of 0.37%).
| Demographics | Rating | Rank | Disability Age Over 75 |
| Armenians | 0.0 /100 | #297 | Tragic 50.0% |
| Marshallese | 0.0 /100 | #298 | Tragic 50.1% |
| Immigrants | Micronesia | 0.0 /100 | #299 | Tragic 50.1% |
| Cape Verdeans | 0.0 /100 | #300 | Tragic 50.1% |
| Dominicans | 0.0 /100 | #301 | Tragic 50.2% |
| Cherokee | 0.0 /100 | #302 | Tragic 50.2% |
| Japanese | 0.0 /100 | #303 | Tragic 50.2% |
| Immigrants | Dominican Republic | 0.0 /100 | #304 | Tragic 50.3% |
| Central American Indians | 0.0 /100 | #305 | Tragic 50.5% |
| Immigrants | Central America | 0.0 /100 | #306 | Tragic 50.5% |
| Immigrants | Fiji | 0.0 /100 | #307 | Tragic 50.6% |
| Hispanics or Latinos | 0.0 /100 | #308 | Tragic 50.6% |
| Aleuts | 0.0 /100 | #309 | Tragic 50.6% |
| Tlingit-Haida | 0.0 /100 | #310 | Tragic 50.6% |
| Cajuns | 0.0 /100 | #311 | Tragic 50.7% |
Demographics Similar to Puerto Ricans by Disability Age Over 75
In terms of disability age over 75, the demographic groups most similar to Puerto Ricans are Hopi (52.9%, a difference of 0.020%), Alaska Native (52.8%, a difference of 0.18%), Native/Alaskan (53.1%, a difference of 0.31%), Choctaw (52.7%, a difference of 0.39%), and Nepalese (52.6%, a difference of 0.58%).
| Demographics | Rating | Rank | Disability Age Over 75 |
| Immigrants | Yemen | 0.0 /100 | #323 | Tragic 52.0% |
| Menominee | 0.0 /100 | #324 | Tragic 52.3% |
| Immigrants | Cabo Verde | 0.0 /100 | #325 | Tragic 52.4% |
| Ute | 0.0 /100 | #326 | Tragic 52.6% |
| Nepalese | 0.0 /100 | #327 | Tragic 52.6% |
| Choctaw | 0.0 /100 | #328 | Tragic 52.7% |
| Alaska Natives | 0.0 /100 | #329 | Tragic 52.8% |
| Puerto Ricans | 0.0 /100 | #330 | Tragic 52.9% |
| Hopi | 0.0 /100 | #331 | Tragic 52.9% |
| Natives/Alaskans | 0.0 /100 | #332 | Tragic 53.1% |
| Apache | 0.0 /100 | #333 | Tragic 53.6% |
| Alaskan Athabascans | 0.0 /100 | #334 | Tragic 54.0% |
| Kiowa | 0.0 /100 | #335 | Tragic 54.2% |
| Immigrants | Armenia | 0.0 /100 | #336 | Tragic 54.3% |
| Yuman | 0.0 /100 | #337 | Tragic 54.4% |