Immigrants from Senegal vs Moroccan Female Disability
COMPARE
Immigrants from Senegal
Moroccan
Female Disability
Female Disability Comparison
Immigrants from Senegal
Moroccans
12.6%
FEMALE DISABILITY
2.5/ 100
METRIC RATING
243rd/ 347
METRIC RANK
12.1%
FEMALE DISABILITY
72.9/ 100
METRIC RATING
156th/ 347
METRIC RANK
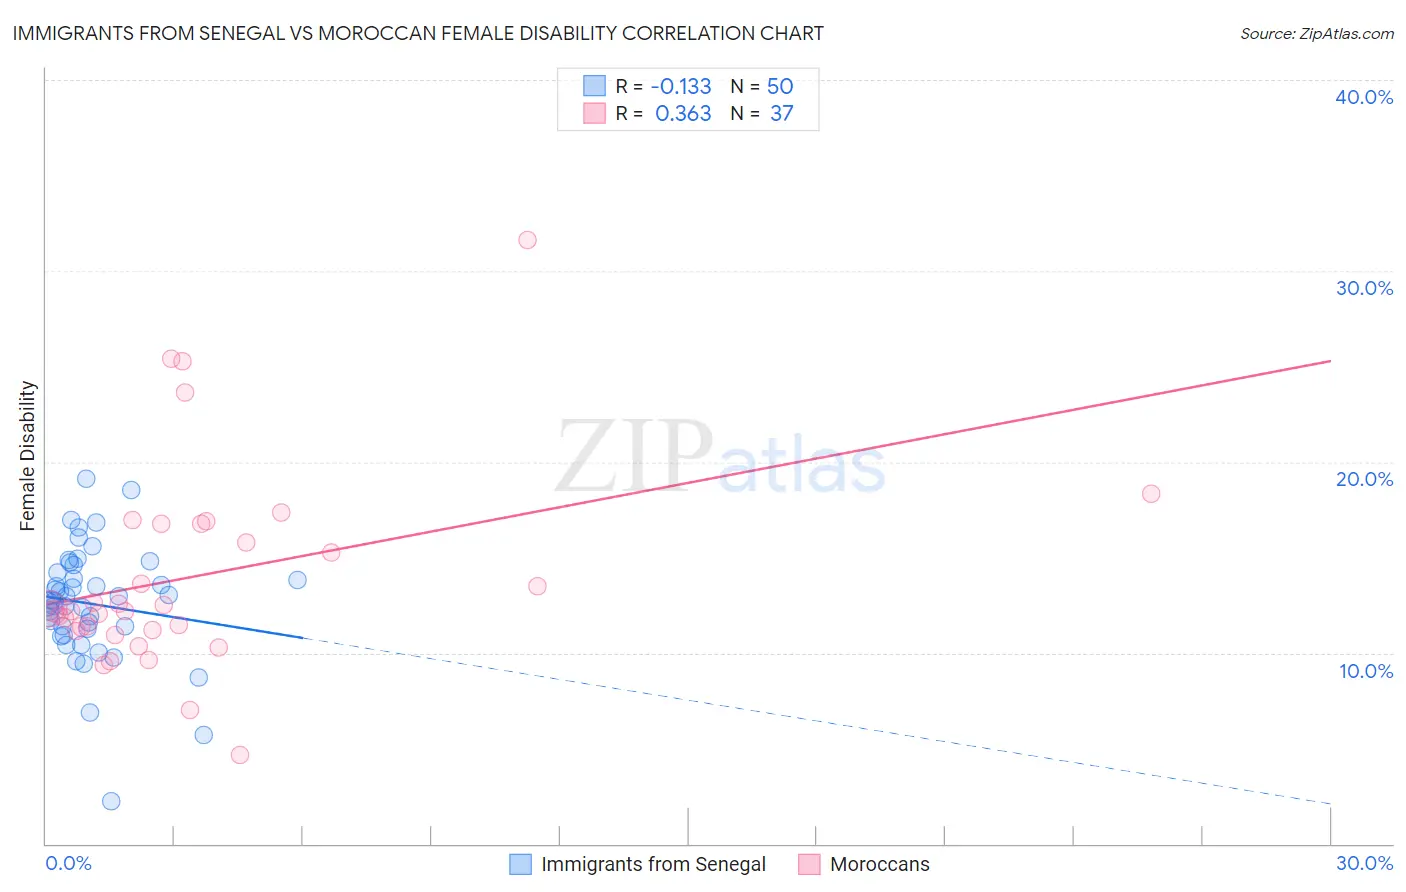
Immigrants from Senegal vs Moroccan Female Disability Correlation Chart
The statistical analysis conducted on geographies consisting of 90,125,924 people shows a poor negative correlation between the proportion of Immigrants from Senegal and percentage of females with a disability in the United States with a correlation coefficient (R) of -0.133 and weighted average of 12.6%. Similarly, the statistical analysis conducted on geographies consisting of 201,802,269 people shows a mild positive correlation between the proportion of Moroccans and percentage of females with a disability in the United States with a correlation coefficient (R) of 0.363 and weighted average of 12.1%, a difference of 4.4%.
Female Disability Correlation Summary
| Measurement | Immigrants from Senegal | Moroccan |
| Minimum | 2.3% | 4.6% |
| Maximum | 19.1% | 31.6% |
| Range | 16.9% | 27.0% |
| Mean | 12.6% | 14.0% |
| Median | 12.7% | 12.2% |
| Interquartile 25% (IQ1) | 11.2% | 11.2% |
| Interquartile 75% (IQ3) | 14.2% | 16.8% |
| Interquartile Range (IQR) | 2.9% | 5.6% |
| Standard Deviation (Sample) | 3.0% | 5.3% |
| Standard Deviation (Population) | 3.0% | 5.3% |
Similar Demographics by Female Disability
Demographics Similar to Immigrants from Senegal by Female Disability
In terms of female disability, the demographic groups most similar to Immigrants from Senegal are Canadian (12.6%, a difference of 0.010%), Alsatian (12.6%, a difference of 0.010%), Japanese (12.6%, a difference of 0.060%), Immigrants from Jamaica (12.6%, a difference of 0.15%), and Spanish American Indian (12.6%, a difference of 0.16%).
| Demographics | Rating | Rank | Female Disability |
| Immigrants | West Indies | 4.4 /100 | #236 | Tragic 12.6% |
| Slavs | 3.8 /100 | #237 | Tragic 12.6% |
| Yugoslavians | 3.7 /100 | #238 | Tragic 12.6% |
| Barbadians | 3.6 /100 | #239 | Tragic 12.6% |
| German Russians | 3.2 /100 | #240 | Tragic 12.6% |
| Japanese | 2.7 /100 | #241 | Tragic 12.6% |
| Canadians | 2.6 /100 | #242 | Tragic 12.6% |
| Immigrants | Senegal | 2.5 /100 | #243 | Tragic 12.6% |
| Alsatians | 2.5 /100 | #244 | Tragic 12.6% |
| Immigrants | Jamaica | 2.2 /100 | #245 | Tragic 12.6% |
| Spanish American Indians | 2.1 /100 | #246 | Tragic 12.6% |
| Menominee | 2.1 /100 | #247 | Tragic 12.6% |
| Carpatho Rusyns | 2.0 /100 | #248 | Tragic 12.6% |
| Immigrants | Congo | 1.8 /100 | #249 | Tragic 12.7% |
| Slovenes | 1.7 /100 | #250 | Tragic 12.7% |
Demographics Similar to Moroccans by Female Disability
In terms of female disability, the demographic groups most similar to Moroccans are Danish (12.1%, a difference of 0.020%), Immigrants from Middle Africa (12.1%, a difference of 0.020%), Ghanaian (12.1%, a difference of 0.19%), Syrian (12.1%, a difference of 0.20%), and Immigrants from Central America (12.1%, a difference of 0.24%).
| Demographics | Rating | Rank | Female Disability |
| Greeks | 82.0 /100 | #149 | Excellent 12.0% |
| Immigrants | Moldova | 81.4 /100 | #150 | Excellent 12.0% |
| Icelanders | 80.7 /100 | #151 | Excellent 12.0% |
| Immigrants | Scotland | 79.3 /100 | #152 | Good 12.0% |
| Sudanese | 79.1 /100 | #153 | Good 12.0% |
| Syrians | 76.9 /100 | #154 | Good 12.1% |
| Ghanaians | 76.6 /100 | #155 | Good 12.1% |
| Moroccans | 72.9 /100 | #156 | Good 12.1% |
| Danes | 72.5 /100 | #157 | Good 12.1% |
| Immigrants | Middle Africa | 72.4 /100 | #158 | Good 12.1% |
| Immigrants | Central America | 67.7 /100 | #159 | Good 12.1% |
| Immigrants | Guatemala | 66.0 /100 | #160 | Good 12.1% |
| Guyanese | 64.7 /100 | #161 | Good 12.1% |
| Immigrants | Ukraine | 64.3 /100 | #162 | Good 12.1% |
| Guatemalans | 63.8 /100 | #163 | Good 12.1% |