Chilean vs Immigrants from Brazil Male Disability
COMPARE
Chilean
Immigrants from Brazil
Male Disability
Male Disability Comparison
Chileans
Immigrants from Brazil
10.7%
MALE DISABILITY
96.9/ 100
METRIC RATING
95th/ 347
METRIC RANK
10.8%
MALE DISABILITY
95.0/ 100
METRIC RATING
105th/ 347
METRIC RANK
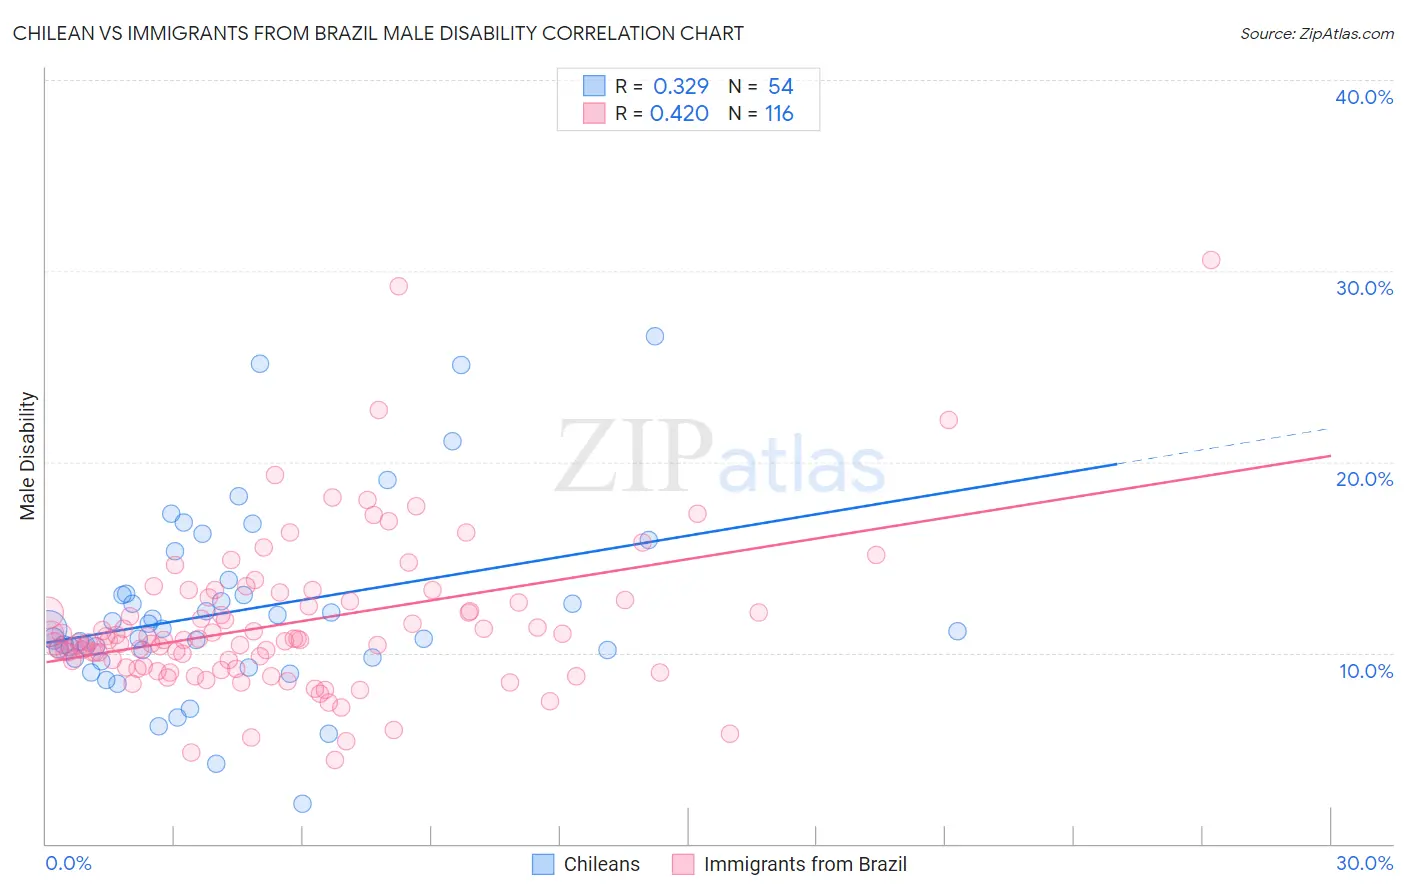
Chilean vs Immigrants from Brazil Male Disability Correlation Chart
The statistical analysis conducted on geographies consisting of 256,663,212 people shows a mild positive correlation between the proportion of Chileans and percentage of males with a disability in the United States with a correlation coefficient (R) of 0.329 and weighted average of 10.7%. Similarly, the statistical analysis conducted on geographies consisting of 342,998,829 people shows a moderate positive correlation between the proportion of Immigrants from Brazil and percentage of males with a disability in the United States with a correlation coefficient (R) of 0.420 and weighted average of 10.8%, a difference of 0.69%.
Male Disability Correlation Summary
| Measurement | Chilean | Immigrants from Brazil |
| Minimum | 2.1% | 4.4% |
| Maximum | 26.6% | 30.6% |
| Range | 24.5% | 26.2% |
| Mean | 12.2% | 11.5% |
| Median | 11.2% | 10.7% |
| Interquartile 25% (IQ1) | 9.8% | 9.3% |
| Interquartile 75% (IQ3) | 13.1% | 12.8% |
| Interquartile Range (IQR) | 3.3% | 3.5% |
| Standard Deviation (Sample) | 4.8% | 4.0% |
| Standard Deviation (Population) | 4.8% | 4.0% |
Demographics Similar to Chileans and Immigrants from Brazil by Male Disability
In terms of male disability, the demographic groups most similar to Chileans are Immigrants from Sweden (10.7%, a difference of 0.030%), Nicaraguan (10.7%, a difference of 0.10%), Immigrants from Armenia (10.7%, a difference of 0.12%), Immigrants from St. Vincent and the Grenadines (10.7%, a difference of 0.14%), and Immigrants from Romania (10.7%, a difference of 0.18%). Similarly, the demographic groups most similar to Immigrants from Brazil are Immigrants from Nigeria (10.8%, a difference of 0.010%), Immigrants from Syria (10.8%, a difference of 0.040%), Uruguayan (10.7%, a difference of 0.080%), Immigrants from Eastern Europe (10.7%, a difference of 0.090%), and Immigrants from Greece (10.7%, a difference of 0.19%).
| Demographics | Rating | Rank | Male Disability |
| Immigrants | Morocco | 97.7 /100 | #90 | Exceptional 10.6% |
| Immigrants | France | 97.6 /100 | #91 | Exceptional 10.6% |
| Palestinians | 97.4 /100 | #92 | Exceptional 10.7% |
| Immigrants | St. Vincent and the Grenadines | 97.1 /100 | #93 | Exceptional 10.7% |
| Immigrants | Sweden | 96.9 /100 | #94 | Exceptional 10.7% |
| Chileans | 96.9 /100 | #95 | Exceptional 10.7% |
| Nicaraguans | 96.6 /100 | #96 | Exceptional 10.7% |
| Immigrants | Armenia | 96.6 /100 | #97 | Exceptional 10.7% |
| Immigrants | Romania | 96.5 /100 | #98 | Exceptional 10.7% |
| Immigrants | Switzerland | 96.1 /100 | #99 | Exceptional 10.7% |
| Immigrants | Kazakhstan | 95.9 /100 | #100 | Exceptional 10.7% |
| Immigrants | Greece | 95.6 /100 | #101 | Exceptional 10.7% |
| Immigrants | Eastern Europe | 95.3 /100 | #102 | Exceptional 10.7% |
| Uruguayans | 95.3 /100 | #103 | Exceptional 10.7% |
| Immigrants | Nigeria | 95.1 /100 | #104 | Exceptional 10.8% |
| Immigrants | Brazil | 95.0 /100 | #105 | Exceptional 10.8% |
| Immigrants | Syria | 94.9 /100 | #106 | Exceptional 10.8% |
| Immigrants | Eastern Africa | 94.3 /100 | #107 | Exceptional 10.8% |
| Immigrants | Belgium | 94.2 /100 | #108 | Exceptional 10.8% |
| Immigrants | Uganda | 94.0 /100 | #109 | Exceptional 10.8% |
| Immigrants | Immigrants | 93.9 /100 | #110 | Exceptional 10.8% |