French vs Central American Indian Disability Age Under 5
COMPARE
French
Central American Indian
Disability Age Under 5
Disability Age Under 5 Comparison
French
Central American Indians
1.7%
DISABILITY AGE UNDER 5
0.0/ 100
METRIC RATING
317th/ 347
METRIC RANK
1.3%
DISABILITY AGE UNDER 5
3.6/ 100
METRIC RATING
235th/ 347
METRIC RANK
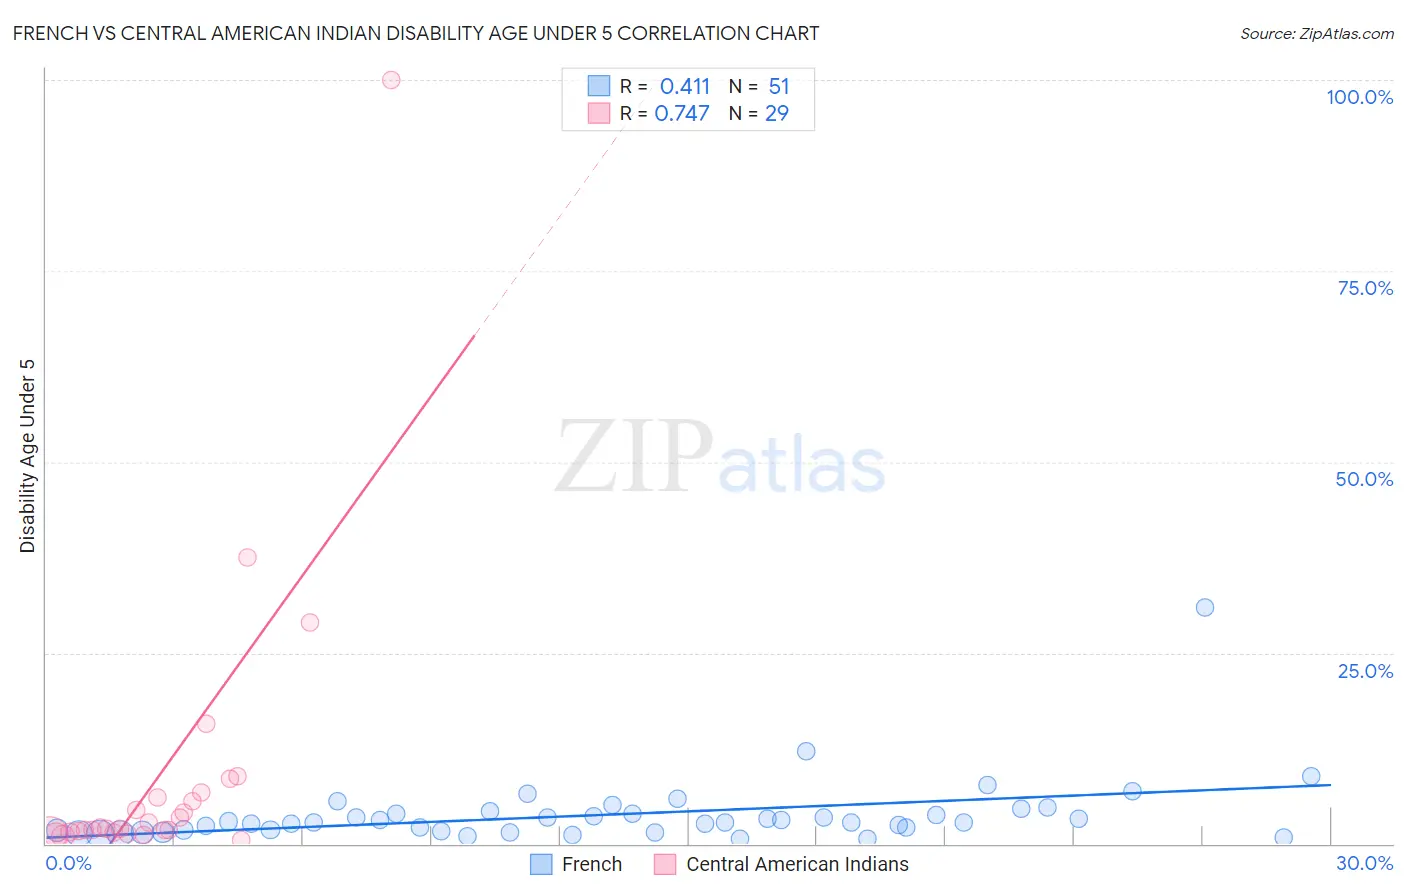
French vs Central American Indian Disability Age Under 5 Correlation Chart
The statistical analysis conducted on geographies consisting of 260,987,253 people shows a moderate positive correlation between the proportion of French and percentage of population with a disability under the age of 5 in the United States with a correlation coefficient (R) of 0.411 and weighted average of 1.7%. Similarly, the statistical analysis conducted on geographies consisting of 195,946,772 people shows a strong positive correlation between the proportion of Central American Indians and percentage of population with a disability under the age of 5 in the United States with a correlation coefficient (R) of 0.747 and weighted average of 1.3%, a difference of 27.0%.
Disability Age Under 5 Correlation Summary
| Measurement | French | Central American Indian |
| Minimum | 0.58% | 0.56% |
| Maximum | 30.9% | 100.0% |
| Range | 30.3% | 99.4% |
| Mean | 3.8% | 8.9% |
| Median | 2.8% | 1.9% |
| Interquartile 25% (IQ1) | 1.7% | 1.5% |
| Interquartile 75% (IQ3) | 3.9% | 6.5% |
| Interquartile Range (IQR) | 2.2% | 4.9% |
| Standard Deviation (Sample) | 4.5% | 19.4% |
| Standard Deviation (Population) | 4.4% | 19.1% |
Similar Demographics by Disability Age Under 5
Demographics Similar to French by Disability Age Under 5
In terms of disability age under 5, the demographic groups most similar to French are Irish (1.7%, a difference of 0.27%), Immigrants from Cabo Verde (1.7%, a difference of 0.42%), Slovak (1.7%, a difference of 0.58%), Dutch (1.7%, a difference of 0.61%), and Norwegian (1.7%, a difference of 0.87%).
| Demographics | Rating | Rank | Disability Age Under 5 |
| Whites/Caucasians | 0.0 /100 | #310 | Tragic 1.7% |
| English | 0.0 /100 | #311 | Tragic 1.7% |
| Puerto Ricans | 0.0 /100 | #312 | Tragic 1.7% |
| Celtics | 0.0 /100 | #313 | Tragic 1.7% |
| Norwegians | 0.0 /100 | #314 | Tragic 1.7% |
| Dutch | 0.0 /100 | #315 | Tragic 1.7% |
| Immigrants | Cabo Verde | 0.0 /100 | #316 | Tragic 1.7% |
| French | 0.0 /100 | #317 | Tragic 1.7% |
| Irish | 0.0 /100 | #318 | Tragic 1.7% |
| Slovaks | 0.0 /100 | #319 | Tragic 1.7% |
| Scotch-Irish | 0.0 /100 | #320 | Tragic 1.7% |
| Ottawa | 0.0 /100 | #321 | Tragic 1.7% |
| Germans | 0.0 /100 | #322 | Tragic 1.7% |
| Chickasaw | 0.0 /100 | #323 | Tragic 1.7% |
| Cherokee | 0.0 /100 | #324 | Tragic 1.8% |
Demographics Similar to Central American Indians by Disability Age Under 5
In terms of disability age under 5, the demographic groups most similar to Central American Indians are Pueblo (1.3%, a difference of 0.070%), South American Indian (1.3%, a difference of 0.20%), Tongan (1.3%, a difference of 0.33%), Basque (1.3%, a difference of 0.44%), and French American Indian (1.3%, a difference of 0.45%).
| Demographics | Rating | Rank | Disability Age Under 5 |
| Luxembourgers | 6.1 /100 | #228 | Tragic 1.3% |
| Immigrants | Costa Rica | 5.5 /100 | #229 | Tragic 1.3% |
| Lebanese | 5.3 /100 | #230 | Tragic 1.3% |
| Immigrants | Northern Europe | 4.7 /100 | #231 | Tragic 1.3% |
| French American Indians | 4.5 /100 | #232 | Tragic 1.3% |
| Tongans | 4.2 /100 | #233 | Tragic 1.3% |
| Pueblo | 3.8 /100 | #234 | Tragic 1.3% |
| Central American Indians | 3.6 /100 | #235 | Tragic 1.3% |
| South American Indians | 3.3 /100 | #236 | Tragic 1.3% |
| Basques | 3.0 /100 | #237 | Tragic 1.3% |
| Spanish American Indians | 2.4 /100 | #238 | Tragic 1.3% |
| Immigrants | Austria | 2.3 /100 | #239 | Tragic 1.3% |
| Native Hawaiians | 2.2 /100 | #240 | Tragic 1.3% |
| Maltese | 2.2 /100 | #241 | Tragic 1.3% |
| Lumbee | 2.1 /100 | #242 | Tragic 1.3% |