Immigrants from Cuba vs Pakistani Disability Age 65 to 74
COMPARE
Immigrants from Cuba
Pakistani
Disability Age 65 to 74
Disability Age 65 to 74 Comparison
Immigrants from Cuba
Pakistanis
23.6%
DISABILITY AGE 65 TO 74
34.0/ 100
METRIC RATING
188th/ 347
METRIC RANK
23.2%
DISABILITY AGE 65 TO 74
57.0/ 100
METRIC RATING
168th/ 347
METRIC RANK
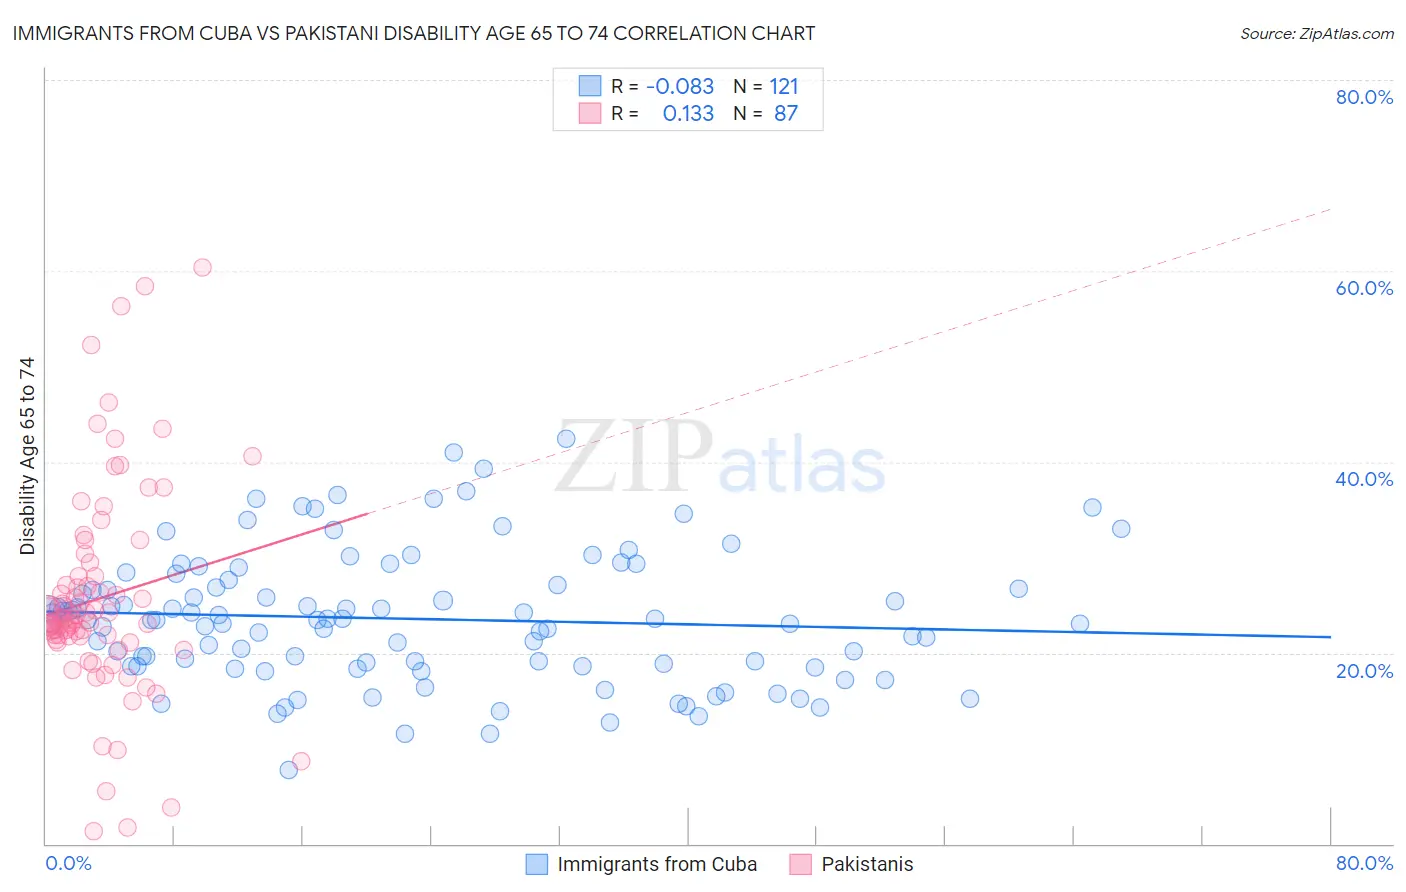
Immigrants from Cuba vs Pakistani Disability Age 65 to 74 Correlation Chart
The statistical analysis conducted on geographies consisting of 325,637,866 people shows a slight negative correlation between the proportion of Immigrants from Cuba and percentage of population with a disability between the ages 65 and 75 in the United States with a correlation coefficient (R) of -0.083 and weighted average of 23.6%. Similarly, the statistical analysis conducted on geographies consisting of 334,780,932 people shows a poor positive correlation between the proportion of Pakistanis and percentage of population with a disability between the ages 65 and 75 in the United States with a correlation coefficient (R) of 0.133 and weighted average of 23.2%, a difference of 1.4%.
Disability Age 65 to 74 Correlation Summary
| Measurement | Immigrants from Cuba | Pakistani |
| Minimum | 7.7% | 1.3% |
| Maximum | 42.5% | 60.4% |
| Range | 34.8% | 59.1% |
| Mean | 23.6% | 25.7% |
| Median | 23.5% | 23.4% |
| Interquartile 25% (IQ1) | 18.6% | 21.4% |
| Interquartile 75% (IQ3) | 27.4% | 28.1% |
| Interquartile Range (IQR) | 8.8% | 6.7% |
| Standard Deviation (Sample) | 6.8% | 11.0% |
| Standard Deviation (Population) | 6.8% | 11.0% |
Demographics Similar to Immigrants from Cuba and Pakistanis by Disability Age 65 to 74
In terms of disability age 65 to 74, the demographic groups most similar to Immigrants from Cuba are Portuguese (23.5%, a difference of 0.24%), Basque (23.5%, a difference of 0.27%), Haitian (23.4%, a difference of 0.51%), Immigrants from Germany (23.4%, a difference of 0.53%), and Immigrants from Eastern Africa (23.4%, a difference of 0.54%). Similarly, the demographic groups most similar to Pakistanis are Icelander (23.3%, a difference of 0.16%), Moroccan (23.3%, a difference of 0.16%), Cuban (23.3%, a difference of 0.30%), German (23.3%, a difference of 0.38%), and Yugoslavian (23.3%, a difference of 0.40%).
| Demographics | Rating | Rank | Disability Age 65 to 74 |
| Pakistanis | 57.0 /100 | #168 | Average 23.2% |
| Icelanders | 54.3 /100 | #169 | Average 23.3% |
| Moroccans | 54.2 /100 | #170 | Average 23.3% |
| Cubans | 51.9 /100 | #171 | Average 23.3% |
| Germans | 50.5 /100 | #172 | Average 23.3% |
| Yugoslavians | 50.2 /100 | #173 | Average 23.3% |
| Immigrants | South Eastern Asia | 50.0 /100 | #174 | Average 23.3% |
| Dutch | 49.4 /100 | #175 | Average 23.3% |
| Immigrants | Eritrea | 47.5 /100 | #176 | Average 23.4% |
| Immigrants | Haiti | 47.5 /100 | #177 | Average 23.4% |
| Guyanese | 45.8 /100 | #178 | Average 23.4% |
| Immigrants | Sierra Leone | 45.8 /100 | #179 | Average 23.4% |
| Scandinavians | 45.6 /100 | #180 | Average 23.4% |
| Assyrians/Chaldeans/Syriacs | 45.3 /100 | #181 | Average 23.4% |
| Irish | 44.4 /100 | #182 | Average 23.4% |
| Immigrants | Eastern Africa | 42.8 /100 | #183 | Average 23.4% |
| Immigrants | Germany | 42.5 /100 | #184 | Average 23.4% |
| Haitians | 42.4 /100 | #185 | Average 23.4% |
| Basques | 38.4 /100 | #186 | Fair 23.5% |
| Portuguese | 37.8 /100 | #187 | Fair 23.5% |
| Immigrants | Cuba | 34.0 /100 | #188 | Fair 23.6% |