Immigrants from Cuba vs Potawatomi Disability Age 65 to 74
COMPARE
Immigrants from Cuba
Potawatomi
Disability Age 65 to 74
Disability Age 65 to 74 Comparison
Immigrants from Cuba
Potawatomi
23.6%
DISABILITY AGE 65 TO 74
34.0/ 100
METRIC RATING
188th/ 347
METRIC RANK
27.0%
DISABILITY AGE 65 TO 74
0.0/ 100
METRIC RATING
299th/ 347
METRIC RANK
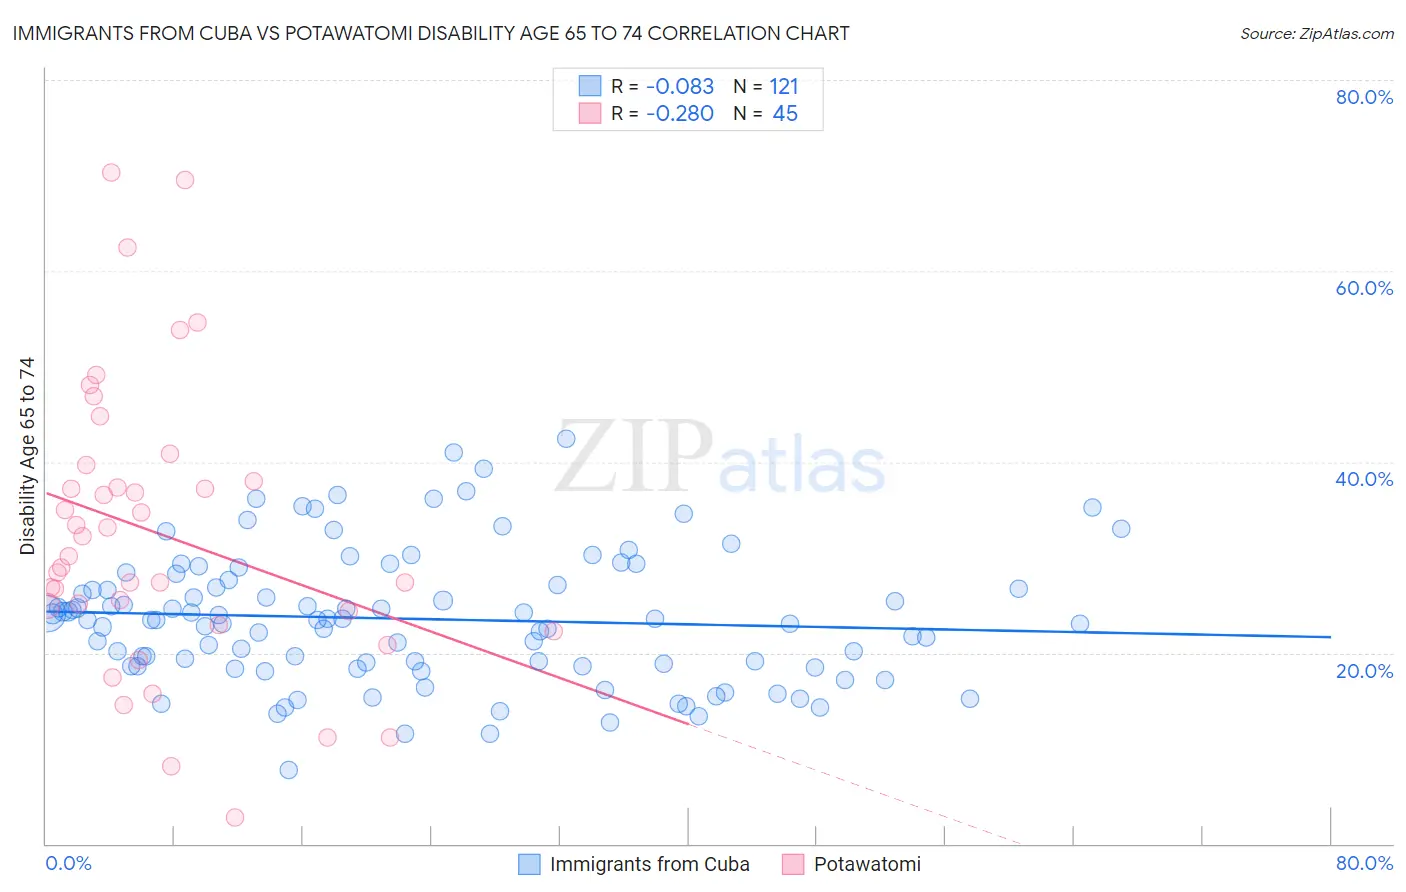
Immigrants from Cuba vs Potawatomi Disability Age 65 to 74 Correlation Chart
The statistical analysis conducted on geographies consisting of 325,637,866 people shows a slight negative correlation between the proportion of Immigrants from Cuba and percentage of population with a disability between the ages 65 and 75 in the United States with a correlation coefficient (R) of -0.083 and weighted average of 23.6%. Similarly, the statistical analysis conducted on geographies consisting of 117,710,706 people shows a weak negative correlation between the proportion of Potawatomi and percentage of population with a disability between the ages 65 and 75 in the United States with a correlation coefficient (R) of -0.280 and weighted average of 27.0%, a difference of 14.6%.
Disability Age 65 to 74 Correlation Summary
| Measurement | Immigrants from Cuba | Potawatomi |
| Minimum | 7.7% | 2.7% |
| Maximum | 42.5% | 70.4% |
| Range | 34.8% | 67.7% |
| Mean | 23.6% | 32.5% |
| Median | 23.5% | 30.1% |
| Interquartile 25% (IQ1) | 18.6% | 23.6% |
| Interquartile 75% (IQ3) | 27.4% | 38.9% |
| Interquartile Range (IQR) | 8.8% | 15.2% |
| Standard Deviation (Sample) | 6.8% | 15.0% |
| Standard Deviation (Population) | 6.8% | 14.9% |
Similar Demographics by Disability Age 65 to 74
Demographics Similar to Immigrants from Cuba by Disability Age 65 to 74
In terms of disability age 65 to 74, the demographic groups most similar to Immigrants from Cuba are Scottish (23.6%, a difference of 0.060%), Immigrants from Guyana (23.6%, a difference of 0.18%), Portuguese (23.5%, a difference of 0.24%), Immigrants from Bangladesh (23.6%, a difference of 0.25%), and Basque (23.5%, a difference of 0.27%).
| Demographics | Rating | Rank | Disability Age 65 to 74 |
| Assyrians/Chaldeans/Syriacs | 45.3 /100 | #181 | Average 23.4% |
| Irish | 44.4 /100 | #182 | Average 23.4% |
| Immigrants | Eastern Africa | 42.8 /100 | #183 | Average 23.4% |
| Immigrants | Germany | 42.5 /100 | #184 | Average 23.4% |
| Haitians | 42.4 /100 | #185 | Average 23.4% |
| Basques | 38.4 /100 | #186 | Fair 23.5% |
| Portuguese | 37.8 /100 | #187 | Fair 23.5% |
| Immigrants | Cuba | 34.0 /100 | #188 | Fair 23.6% |
| Scottish | 33.1 /100 | #189 | Fair 23.6% |
| Immigrants | Guyana | 31.2 /100 | #190 | Fair 23.6% |
| Immigrants | Bangladesh | 30.2 /100 | #191 | Fair 23.6% |
| Ecuadorians | 29.7 /100 | #192 | Fair 23.6% |
| English | 28.5 /100 | #193 | Fair 23.6% |
| Sudanese | 27.8 /100 | #194 | Fair 23.7% |
| Immigrants | St. Vincent and the Grenadines | 26.1 /100 | #195 | Fair 23.7% |
Demographics Similar to Potawatomi by Disability Age 65 to 74
In terms of disability age 65 to 74, the demographic groups most similar to Potawatomi are Immigrants from Yemen (27.0%, a difference of 0.030%), Immigrants from Dominican Republic (27.0%, a difference of 0.030%), Fijian (27.0%, a difference of 0.050%), Immigrants from Mexico (27.1%, a difference of 0.35%), and Central American Indian (27.1%, a difference of 0.36%).
| Demographics | Rating | Rank | Disability Age 65 to 74 |
| Blackfeet | 0.0 /100 | #292 | Tragic 26.6% |
| Immigrants | Central America | 0.0 /100 | #293 | Tragic 26.6% |
| Dominicans | 0.0 /100 | #294 | Tragic 26.7% |
| Hispanics or Latinos | 0.0 /100 | #295 | Tragic 26.7% |
| Bangladeshis | 0.0 /100 | #296 | Tragic 26.8% |
| Fijians | 0.0 /100 | #297 | Tragic 27.0% |
| Immigrants | Yemen | 0.0 /100 | #298 | Tragic 27.0% |
| Potawatomi | 0.0 /100 | #299 | Tragic 27.0% |
| Immigrants | Dominican Republic | 0.0 /100 | #300 | Tragic 27.0% |
| Immigrants | Mexico | 0.0 /100 | #301 | Tragic 27.1% |
| Central American Indians | 0.0 /100 | #302 | Tragic 27.1% |
| Tlingit-Haida | 0.0 /100 | #303 | Tragic 27.1% |
| Puget Sound Salish | 0.0 /100 | #304 | Tragic 27.2% |
| Mexicans | 0.0 /100 | #305 | Tragic 27.2% |
| Blacks/African Americans | 0.0 /100 | #306 | Tragic 27.3% |