Immigrants from Colombia vs Immigrants from Ireland In Labor Force | Age 20-24
COMPARE
Immigrants from Colombia
Immigrants from Ireland
In Labor Force | Age 20-24
In Labor Force | Age 20-24 Comparison
Immigrants from Colombia
Immigrants from Ireland
73.4%
IN LABOR FORCE | AGE 20-24
0.2/ 100
METRIC RATING
274th/ 347
METRIC RANK
74.3%
IN LABOR FORCE | AGE 20-24
5.8/ 100
METRIC RATING
227th/ 347
METRIC RANK
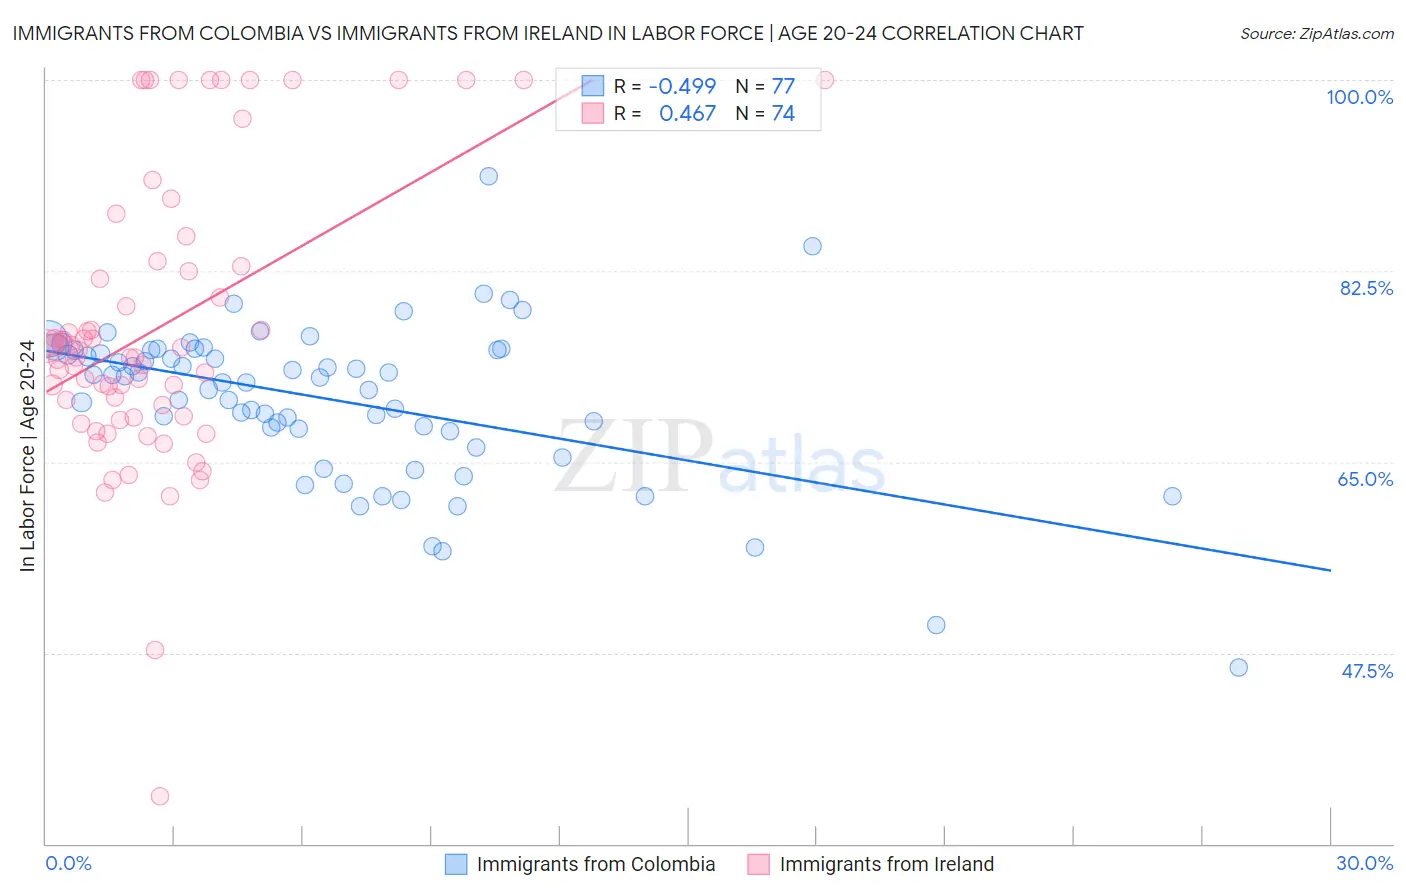
Immigrants from Colombia vs Immigrants from Ireland In Labor Force | Age 20-24 Correlation Chart
The statistical analysis conducted on geographies consisting of 378,565,425 people shows a moderate negative correlation between the proportion of Immigrants from Colombia and labor force participation rate among population between the ages 20 and 24 in the United States with a correlation coefficient (R) of -0.499 and weighted average of 73.4%. Similarly, the statistical analysis conducted on geographies consisting of 240,706,674 people shows a moderate positive correlation between the proportion of Immigrants from Ireland and labor force participation rate among population between the ages 20 and 24 in the United States with a correlation coefficient (R) of 0.467 and weighted average of 74.3%, a difference of 1.2%.
In Labor Force | Age 20-24 Correlation Summary
| Measurement | Immigrants from Colombia | Immigrants from Ireland |
| Minimum | 46.2% | 34.3% |
| Maximum | 91.2% | 100.0% |
| Range | 45.0% | 65.7% |
| Mean | 70.7% | 77.3% |
| Median | 72.7% | 74.9% |
| Interquartile 25% (IQ1) | 67.9% | 69.2% |
| Interquartile 75% (IQ3) | 75.2% | 82.9% |
| Interquartile Range (IQR) | 7.3% | 13.7% |
| Standard Deviation (Sample) | 7.3% | 13.1% |
| Standard Deviation (Population) | 7.2% | 13.0% |
Similar Demographics by In Labor Force | Age 20-24
Demographics Similar to Immigrants from Colombia by In Labor Force | Age 20-24
In terms of in labor force | age 20-24, the demographic groups most similar to Immigrants from Colombia are Cheyenne (73.4%, a difference of 0.020%), Belizean (73.4%, a difference of 0.050%), Immigrants from South America (73.3%, a difference of 0.050%), Immigrants from Indonesia (73.4%, a difference of 0.060%), and Mongolian (73.3%, a difference of 0.070%).
| Demographics | Rating | Rank | In Labor Force | Age 20-24 |
| Immigrants | Western Asia | 0.4 /100 | #267 | Tragic 73.5% |
| South Americans | 0.4 /100 | #268 | Tragic 73.5% |
| Colombians | 0.3 /100 | #269 | Tragic 73.5% |
| Immigrants | Russia | 0.3 /100 | #270 | Tragic 73.5% |
| Immigrants | Indonesia | 0.3 /100 | #271 | Tragic 73.4% |
| Belizeans | 0.3 /100 | #272 | Tragic 73.4% |
| Cheyenne | 0.2 /100 | #273 | Tragic 73.4% |
| Immigrants | Colombia | 0.2 /100 | #274 | Tragic 73.4% |
| Immigrants | South America | 0.2 /100 | #275 | Tragic 73.3% |
| Mongolians | 0.2 /100 | #276 | Tragic 73.3% |
| Immigrants | Malaysia | 0.2 /100 | #277 | Tragic 73.3% |
| Cypriots | 0.2 /100 | #278 | Tragic 73.3% |
| Venezuelans | 0.2 /100 | #279 | Tragic 73.3% |
| Bahamians | 0.1 /100 | #280 | Tragic 73.3% |
| Immigrants | Venezuela | 0.1 /100 | #281 | Tragic 73.2% |
Demographics Similar to Immigrants from Ireland by In Labor Force | Age 20-24
In terms of in labor force | age 20-24, the demographic groups most similar to Immigrants from Ireland are Immigrants from Fiji (74.3%, a difference of 0.010%), Ghanaian (74.3%, a difference of 0.030%), Immigrants from Ukraine (74.2%, a difference of 0.050%), Seminole (74.3%, a difference of 0.070%), and Immigrants from Sweden (74.2%, a difference of 0.090%).
| Demographics | Rating | Rank | In Labor Force | Age 20-24 |
| Immigrants | Norway | 10.3 /100 | #220 | Poor 74.5% |
| Chickasaw | 10.3 /100 | #221 | Poor 74.5% |
| Immigrants | India | 9.9 /100 | #222 | Tragic 74.4% |
| Hispanics or Latinos | 7.9 /100 | #223 | Tragic 74.4% |
| Seminole | 6.9 /100 | #224 | Tragic 74.3% |
| Ghanaians | 6.2 /100 | #225 | Tragic 74.3% |
| Immigrants | Fiji | 5.9 /100 | #226 | Tragic 74.3% |
| Immigrants | Ireland | 5.8 /100 | #227 | Tragic 74.3% |
| Immigrants | Ukraine | 5.1 /100 | #228 | Tragic 74.2% |
| Immigrants | Sweden | 4.6 /100 | #229 | Tragic 74.2% |
| Immigrants | Albania | 4.3 /100 | #230 | Tragic 74.2% |
| Immigrants | Greece | 4.1 /100 | #231 | Tragic 74.2% |
| Immigrants | Switzerland | 4.1 /100 | #232 | Tragic 74.2% |
| Immigrants | Chile | 3.7 /100 | #233 | Tragic 74.1% |
| Immigrants | Immigrants | 3.6 /100 | #234 | Tragic 74.1% |