Immigrants from Colombia vs Immigrants from Belarus Self-Care Disability
COMPARE
Immigrants from Colombia
Immigrants from Belarus
Self-Care Disability
Self-Care Disability Comparison
Immigrants from Colombia
Immigrants from Belarus
2.4%
SELF-CARE DISABILITY
88.5/ 100
METRIC RATING
133rd/ 347
METRIC RANK
2.6%
SELF-CARE DISABILITY
0.2/ 100
METRIC RATING
259th/ 347
METRIC RANK
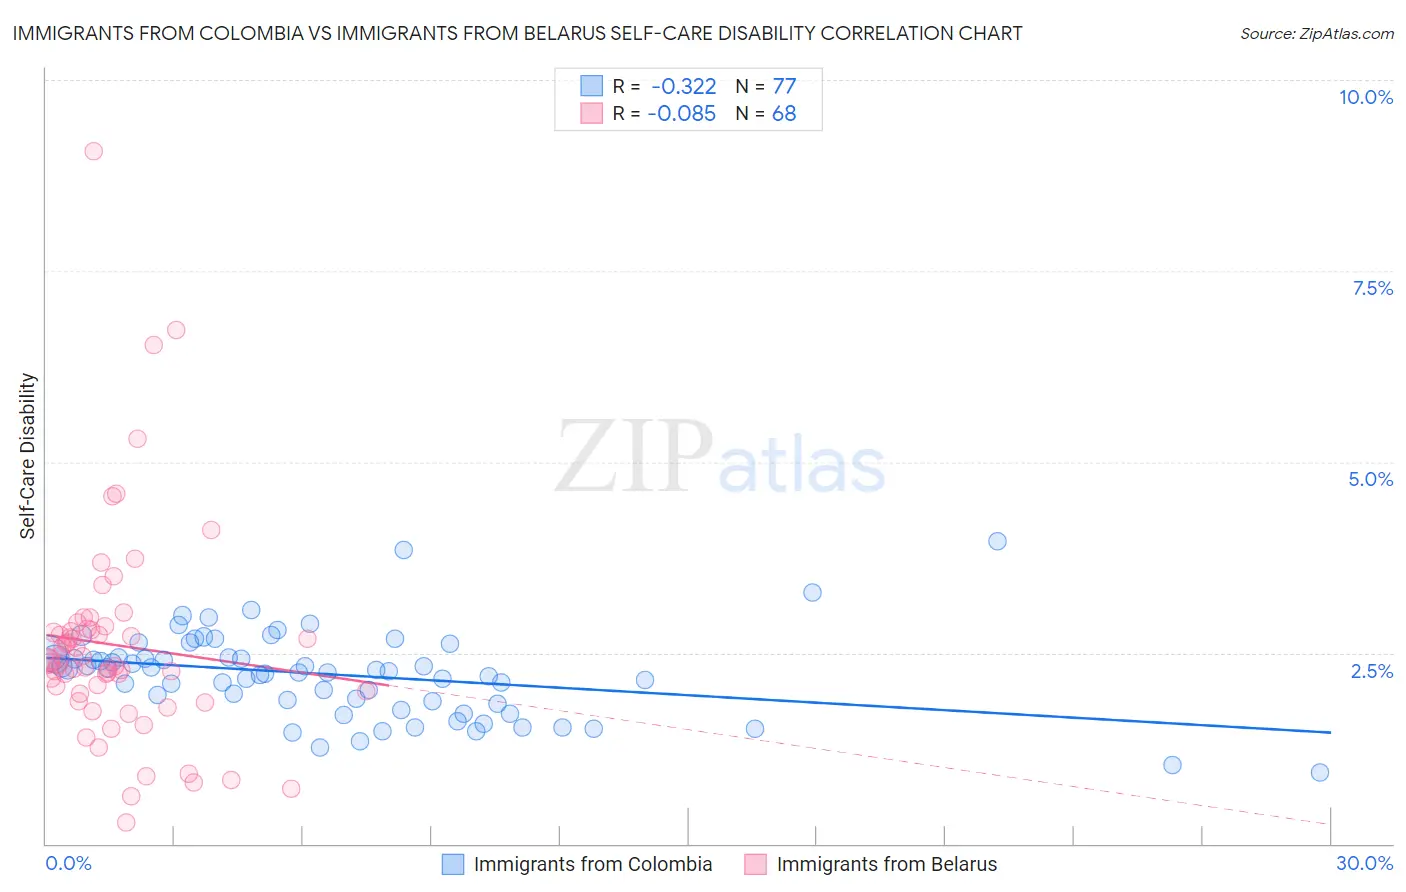
Immigrants from Colombia vs Immigrants from Belarus Self-Care Disability Correlation Chart
The statistical analysis conducted on geographies consisting of 378,342,946 people shows a mild negative correlation between the proportion of Immigrants from Colombia and percentage of population with self-care disability in the United States with a correlation coefficient (R) of -0.322 and weighted average of 2.4%. Similarly, the statistical analysis conducted on geographies consisting of 150,167,349 people shows a slight negative correlation between the proportion of Immigrants from Belarus and percentage of population with self-care disability in the United States with a correlation coefficient (R) of -0.085 and weighted average of 2.6%, a difference of 9.9%.
Self-Care Disability Correlation Summary
| Measurement | Immigrants from Colombia | Immigrants from Belarus |
| Minimum | 0.93% | 0.28% |
| Maximum | 4.0% | 9.1% |
| Range | 3.0% | 8.8% |
| Mean | 2.2% | 2.6% |
| Median | 2.3% | 2.4% |
| Interquartile 25% (IQ1) | 1.8% | 2.0% |
| Interquartile 75% (IQ3) | 2.5% | 2.8% |
| Interquartile Range (IQR) | 0.62% | 0.83% |
| Standard Deviation (Sample) | 0.56% | 1.4% |
| Standard Deviation (Population) | 0.56% | 1.4% |
Similar Demographics by Self-Care Disability
Demographics Similar to Immigrants from Colombia by Self-Care Disability
In terms of self-care disability, the demographic groups most similar to Immigrants from Colombia are Immigrants from South America (2.4%, a difference of 0.030%), Polish (2.4%, a difference of 0.040%), Russian (2.4%, a difference of 0.040%), Immigrants from Austria (2.4%, a difference of 0.060%), and Immigrants from Romania (2.4%, a difference of 0.090%).
| Demographics | Rating | Rank | Self-Care Disability |
| Hmong | 89.9 /100 | #126 | Excellent 2.4% |
| Colombians | 89.7 /100 | #127 | Excellent 2.4% |
| Immigrants | Hungary | 89.6 /100 | #128 | Excellent 2.4% |
| Immigrants | Romania | 89.3 /100 | #129 | Excellent 2.4% |
| Immigrants | Austria | 89.0 /100 | #130 | Excellent 2.4% |
| Poles | 88.9 /100 | #131 | Excellent 2.4% |
| Immigrants | South America | 88.8 /100 | #132 | Excellent 2.4% |
| Immigrants | Colombia | 88.5 /100 | #133 | Excellent 2.4% |
| Russians | 88.2 /100 | #134 | Excellent 2.4% |
| Laotians | 87.8 /100 | #135 | Excellent 2.4% |
| South American Indians | 87.2 /100 | #136 | Excellent 2.4% |
| Austrians | 87.0 /100 | #137 | Excellent 2.4% |
| Immigrants | Croatia | 86.6 /100 | #138 | Excellent 2.4% |
| Sri Lankans | 86.6 /100 | #139 | Excellent 2.4% |
| Immigrants | Uruguay | 85.4 /100 | #140 | Excellent 2.4% |
Demographics Similar to Immigrants from Belarus by Self-Care Disability
In terms of self-care disability, the demographic groups most similar to Immigrants from Belarus are Chippewa (2.6%, a difference of 0.040%), Arapaho (2.6%, a difference of 0.060%), Nonimmigrants (2.6%, a difference of 0.070%), Potawatomi (2.6%, a difference of 0.14%), and Shoshone (2.7%, a difference of 0.20%).
| Demographics | Rating | Rank | Self-Care Disability |
| Immigrants | Bangladesh | 0.4 /100 | #252 | Tragic 2.6% |
| Immigrants | Haiti | 0.3 /100 | #253 | Tragic 2.6% |
| Haitians | 0.3 /100 | #254 | Tragic 2.6% |
| Tsimshian | 0.3 /100 | #255 | Tragic 2.6% |
| Immigrants | Central America | 0.3 /100 | #256 | Tragic 2.6% |
| Potawatomi | 0.3 /100 | #257 | Tragic 2.6% |
| Immigrants | Nonimmigrants | 0.3 /100 | #258 | Tragic 2.6% |
| Immigrants | Belarus | 0.2 /100 | #259 | Tragic 2.6% |
| Chippewa | 0.2 /100 | #260 | Tragic 2.6% |
| Arapaho | 0.2 /100 | #261 | Tragic 2.6% |
| Shoshone | 0.2 /100 | #262 | Tragic 2.7% |
| Immigrants | Latin America | 0.2 /100 | #263 | Tragic 2.7% |
| Immigrants | Iran | 0.2 /100 | #264 | Tragic 2.7% |
| Immigrants | Nicaragua | 0.2 /100 | #265 | Tragic 2.7% |
| Immigrants | Cambodia | 0.1 /100 | #266 | Tragic 2.7% |