Immigrants from China vs Immigrants from Yemen Disability Age Over 75
COMPARE
Immigrants from China
Immigrants from Yemen
Disability Age Over 75
Disability Age Over 75 Comparison
Immigrants from China
Immigrants from Yemen
46.3%
DISABILITY AGE OVER 75
98.0/ 100
METRIC RATING
96th/ 347
METRIC RANK
52.0%
DISABILITY AGE OVER 75
0.0/ 100
METRIC RATING
323rd/ 347
METRIC RANK
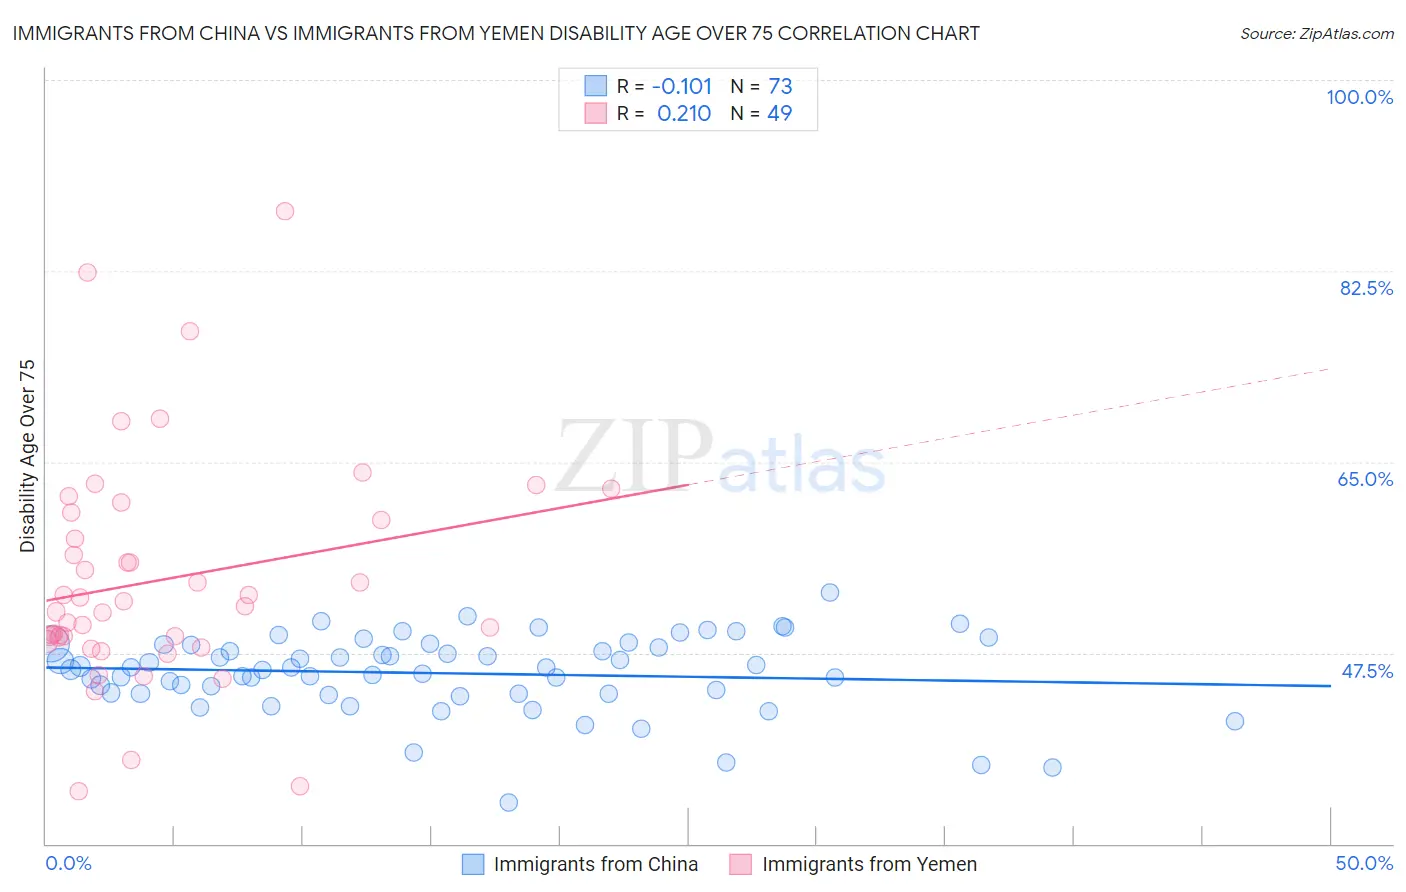
Immigrants from China vs Immigrants from Yemen Disability Age Over 75 Correlation Chart
The statistical analysis conducted on geographies consisting of 455,855,137 people shows a poor negative correlation between the proportion of Immigrants from China and percentage of population with a disability over the age of 75 in the United States with a correlation coefficient (R) of -0.101 and weighted average of 46.3%. Similarly, the statistical analysis conducted on geographies consisting of 82,401,520 people shows a weak positive correlation between the proportion of Immigrants from Yemen and percentage of population with a disability over the age of 75 in the United States with a correlation coefficient (R) of 0.210 and weighted average of 52.0%, a difference of 12.2%.
Disability Age Over 75 Correlation Summary
| Measurement | Immigrants from China | Immigrants from Yemen |
| Minimum | 33.8% | 34.8% |
| Maximum | 53.1% | 88.0% |
| Range | 19.3% | 53.2% |
| Mean | 45.6% | 54.2% |
| Median | 46.2% | 51.8% |
| Interquartile 25% (IQ1) | 43.8% | 48.7% |
| Interquartile 75% (IQ3) | 48.3% | 60.0% |
| Interquartile Range (IQR) | 4.5% | 11.3% |
| Standard Deviation (Sample) | 3.6% | 10.4% |
| Standard Deviation (Population) | 3.5% | 10.3% |
Similar Demographics by Disability Age Over 75
Demographics Similar to Immigrants from China by Disability Age Over 75
In terms of disability age over 75, the demographic groups most similar to Immigrants from China are Immigrants from Brazil (46.3%, a difference of 0.010%), Finnish (46.3%, a difference of 0.020%), Albanian (46.3%, a difference of 0.030%), Immigrants from Japan (46.3%, a difference of 0.030%), and Ugandan (46.3%, a difference of 0.060%).
| Demographics | Rating | Rank | Disability Age Over 75 |
| Immigrants | Saudi Arabia | 98.4 /100 | #89 | Exceptional 46.3% |
| Northern Europeans | 98.3 /100 | #90 | Exceptional 46.3% |
| Immigrants | Egypt | 98.3 /100 | #91 | Exceptional 46.3% |
| Germans | 98.2 /100 | #92 | Exceptional 46.3% |
| Ugandans | 98.2 /100 | #93 | Exceptional 46.3% |
| Albanians | 98.1 /100 | #94 | Exceptional 46.3% |
| Immigrants | Brazil | 98.0 /100 | #95 | Exceptional 46.3% |
| Immigrants | China | 98.0 /100 | #96 | Exceptional 46.3% |
| Finns | 97.9 /100 | #97 | Exceptional 46.3% |
| Immigrants | Japan | 97.8 /100 | #98 | Exceptional 46.3% |
| Palestinians | 97.7 /100 | #99 | Exceptional 46.3% |
| Immigrants | Eastern Europe | 97.7 /100 | #100 | Exceptional 46.3% |
| Mongolians | 97.7 /100 | #101 | Exceptional 46.3% |
| Immigrants | Malaysia | 97.1 /100 | #102 | Exceptional 46.4% |
| Ukrainians | 97.1 /100 | #103 | Exceptional 46.4% |
Demographics Similar to Immigrants from Yemen by Disability Age Over 75
In terms of disability age over 75, the demographic groups most similar to Immigrants from Yemen are Comanche (51.7%, a difference of 0.52%), Menominee (52.3%, a difference of 0.63%), Immigrants from Cabo Verde (52.4%, a difference of 0.80%), Paiute (51.5%, a difference of 0.86%), and Dutch West Indian (51.5%, a difference of 0.86%).
| Demographics | Rating | Rank | Disability Age Over 75 |
| Chickasaw | 0.0 /100 | #316 | Tragic 51.2% |
| Yakama | 0.0 /100 | #317 | Tragic 51.3% |
| Seminole | 0.0 /100 | #318 | Tragic 51.5% |
| Creek | 0.0 /100 | #319 | Tragic 51.5% |
| Paiute | 0.0 /100 | #320 | Tragic 51.5% |
| Dutch West Indians | 0.0 /100 | #321 | Tragic 51.5% |
| Comanche | 0.0 /100 | #322 | Tragic 51.7% |
| Immigrants | Yemen | 0.0 /100 | #323 | Tragic 52.0% |
| Menominee | 0.0 /100 | #324 | Tragic 52.3% |
| Immigrants | Cabo Verde | 0.0 /100 | #325 | Tragic 52.4% |
| Ute | 0.0 /100 | #326 | Tragic 52.6% |
| Nepalese | 0.0 /100 | #327 | Tragic 52.6% |
| Choctaw | 0.0 /100 | #328 | Tragic 52.7% |
| Alaska Natives | 0.0 /100 | #329 | Tragic 52.8% |
| Puerto Ricans | 0.0 /100 | #330 | Tragic 52.9% |