Immigrants from China vs Central American Disability Age 65 to 74
COMPARE
Immigrants from China
Central American
Disability Age 65 to 74
Disability Age 65 to 74 Comparison
Immigrants from China
Central Americans
20.3%
DISABILITY AGE 65 TO 74
100.0/ 100
METRIC RATING
9th/ 347
METRIC RANK
25.1%
DISABILITY AGE 65 TO 74
0.5/ 100
METRIC RATING
255th/ 347
METRIC RANK
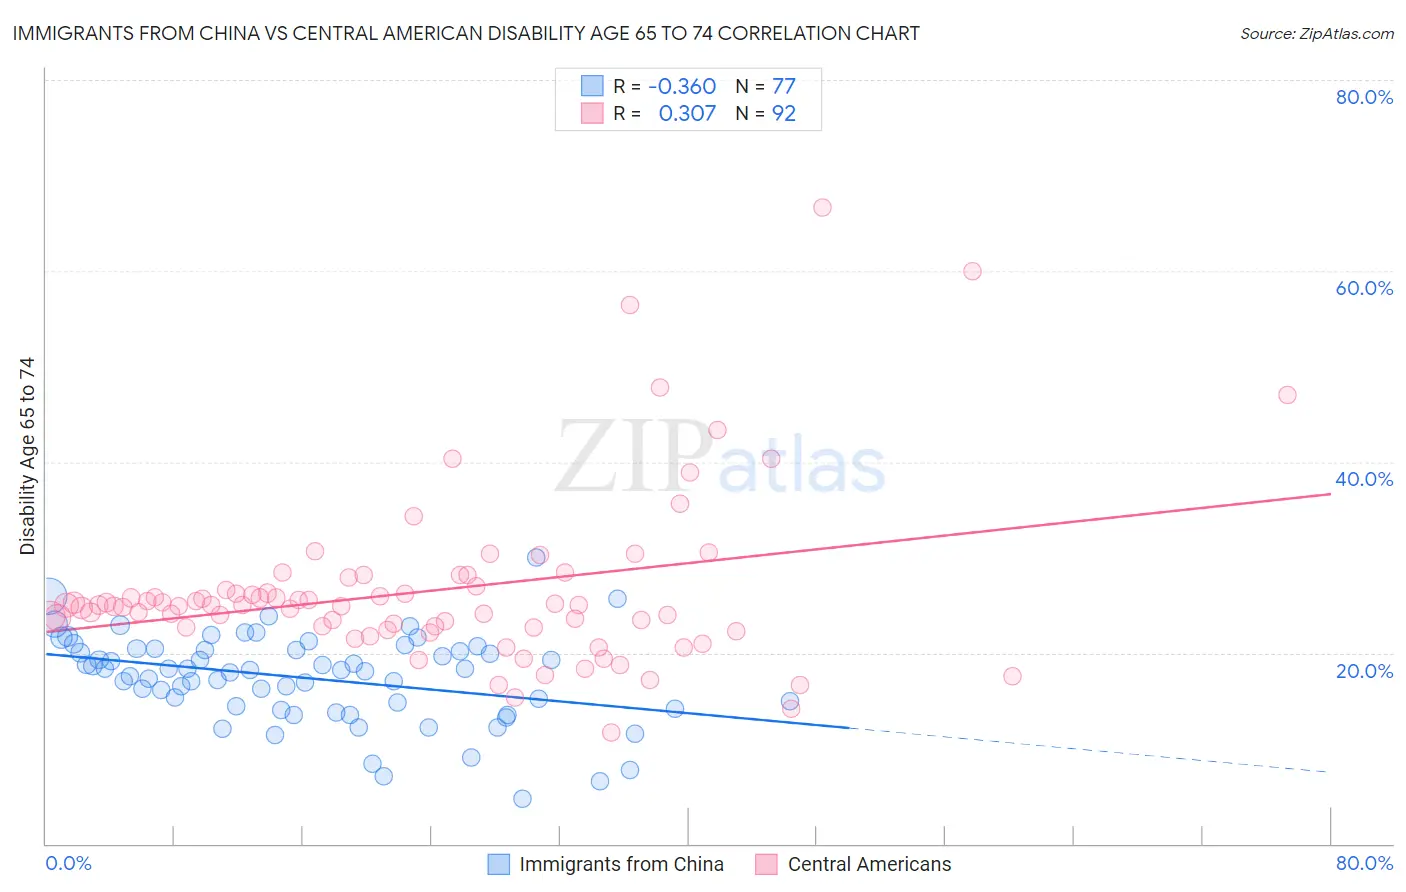
Immigrants from China vs Central American Disability Age 65 to 74 Correlation Chart
The statistical analysis conducted on geographies consisting of 455,755,580 people shows a mild negative correlation between the proportion of Immigrants from China and percentage of population with a disability between the ages 65 and 75 in the United States with a correlation coefficient (R) of -0.360 and weighted average of 20.3%. Similarly, the statistical analysis conducted on geographies consisting of 503,060,028 people shows a mild positive correlation between the proportion of Central Americans and percentage of population with a disability between the ages 65 and 75 in the United States with a correlation coefficient (R) of 0.307 and weighted average of 25.1%, a difference of 24.0%.
Disability Age 65 to 74 Correlation Summary
| Measurement | Immigrants from China | Central American |
| Minimum | 4.7% | 11.6% |
| Maximum | 30.0% | 66.7% |
| Range | 25.3% | 55.1% |
| Mean | 17.3% | 26.5% |
| Median | 18.2% | 25.0% |
| Interquartile 25% (IQ1) | 14.3% | 22.7% |
| Interquartile 75% (IQ3) | 20.4% | 26.8% |
| Interquartile Range (IQR) | 6.1% | 4.1% |
| Standard Deviation (Sample) | 4.6% | 8.9% |
| Standard Deviation (Population) | 4.6% | 8.9% |
Similar Demographics by Disability Age 65 to 74
Demographics Similar to Immigrants from China by Disability Age 65 to 74
In terms of disability age 65 to 74, the demographic groups most similar to Immigrants from China are Immigrants from Eastern Asia (20.3%, a difference of 0.070%), Immigrants from Ireland (20.3%, a difference of 0.23%), Immigrants from Korea (20.4%, a difference of 0.45%), Immigrants from Singapore (20.4%, a difference of 0.83%), and Thai (20.1%, a difference of 0.96%).
| Demographics | Rating | Rank | Disability Age 65 to 74 |
| Filipinos | 100.0 /100 | #2 | Exceptional 19.0% |
| Immigrants | India | 100.0 /100 | #3 | Exceptional 19.7% |
| Immigrants | Hong Kong | 100.0 /100 | #4 | Exceptional 19.9% |
| Immigrants | Israel | 100.0 /100 | #5 | Exceptional 19.9% |
| Iranians | 100.0 /100 | #6 | Exceptional 19.9% |
| Cypriots | 100.0 /100 | #7 | Exceptional 20.1% |
| Thais | 100.0 /100 | #8 | Exceptional 20.1% |
| Immigrants | China | 100.0 /100 | #9 | Exceptional 20.3% |
| Immigrants | Eastern Asia | 100.0 /100 | #10 | Exceptional 20.3% |
| Immigrants | Ireland | 100.0 /100 | #11 | Exceptional 20.3% |
| Immigrants | Korea | 100.0 /100 | #12 | Exceptional 20.4% |
| Immigrants | Singapore | 100.0 /100 | #13 | Exceptional 20.4% |
| Indians (Asian) | 100.0 /100 | #14 | Exceptional 20.5% |
| Paraguayans | 100.0 /100 | #15 | Exceptional 20.5% |
| Immigrants | Lithuania | 100.0 /100 | #16 | Exceptional 20.5% |
Demographics Similar to Central Americans by Disability Age 65 to 74
In terms of disability age 65 to 74, the demographic groups most similar to Central Americans are Somali (25.1%, a difference of 0.16%), Subsaharan African (25.1%, a difference of 0.23%), Immigrants from El Salvador (25.1%, a difference of 0.27%), Immigrants from Somalia (25.2%, a difference of 0.41%), and Nonimmigrants (25.0%, a difference of 0.46%).
| Demographics | Rating | Rank | Disability Age 65 to 74 |
| Senegalese | 0.9 /100 | #248 | Tragic 24.9% |
| Immigrants | Fiji | 0.8 /100 | #249 | Tragic 25.0% |
| Salvadorans | 0.8 /100 | #250 | Tragic 25.0% |
| Immigrants | Nonimmigrants | 0.7 /100 | #251 | Tragic 25.0% |
| Immigrants | El Salvador | 0.6 /100 | #252 | Tragic 25.1% |
| Sub-Saharan Africans | 0.6 /100 | #253 | Tragic 25.1% |
| Somalis | 0.6 /100 | #254 | Tragic 25.1% |
| Central Americans | 0.5 /100 | #255 | Tragic 25.1% |
| Immigrants | Somalia | 0.4 /100 | #256 | Tragic 25.2% |
| Guamanians/Chamorros | 0.3 /100 | #257 | Tragic 25.3% |
| Marshallese | 0.3 /100 | #258 | Tragic 25.3% |
| Immigrants | Cambodia | 0.3 /100 | #259 | Tragic 25.3% |
| Malaysians | 0.2 /100 | #260 | Tragic 25.4% |
| Cape Verdeans | 0.2 /100 | #261 | Tragic 25.4% |
| Samoans | 0.2 /100 | #262 | Tragic 25.4% |