Immigrants from Chile vs Asian Cognitive Disability
COMPARE
Immigrants from Chile
Asian
Cognitive Disability
Cognitive Disability Comparison
Immigrants from Chile
Asians
17.0%
COGNITIVE DISABILITY
91.7/ 100
METRIC RATING
134th/ 347
METRIC RANK
16.7%
COGNITIVE DISABILITY
98.7/ 100
METRIC RATING
94th/ 347
METRIC RANK
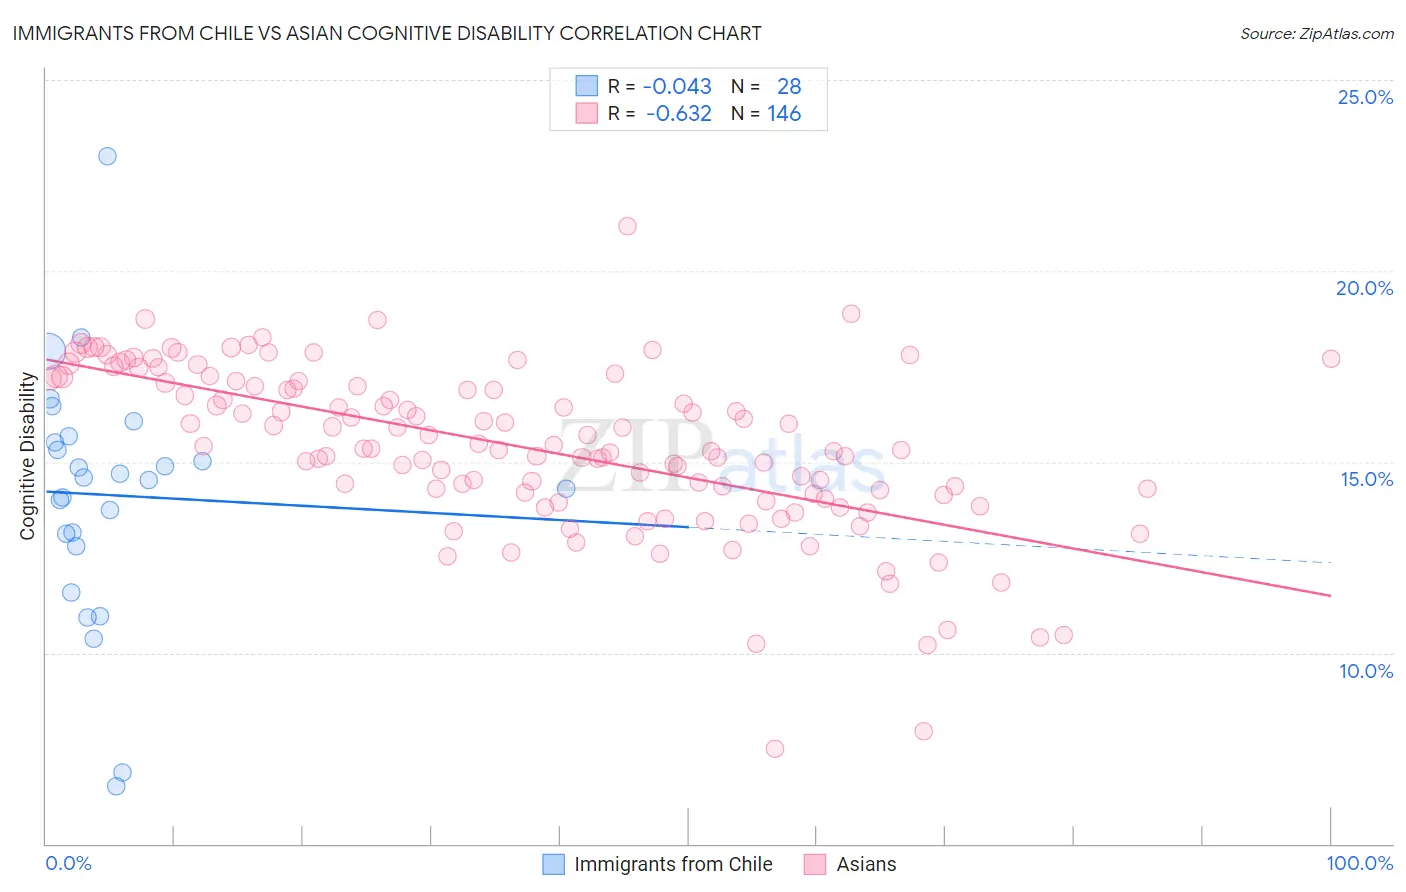
Immigrants from Chile vs Asian Cognitive Disability Correlation Chart
The statistical analysis conducted on geographies consisting of 218,627,878 people shows no correlation between the proportion of Immigrants from Chile and percentage of population with cognitive disability in the United States with a correlation coefficient (R) of -0.043 and weighted average of 17.0%. Similarly, the statistical analysis conducted on geographies consisting of 550,791,869 people shows a significant negative correlation between the proportion of Asians and percentage of population with cognitive disability in the United States with a correlation coefficient (R) of -0.632 and weighted average of 16.7%, a difference of 1.4%.
Cognitive Disability Correlation Summary
| Measurement | Immigrants from Chile | Asian |
| Minimum | 6.5% | 7.5% |
| Maximum | 23.0% | 21.2% |
| Range | 16.5% | 13.7% |
| Mean | 14.1% | 15.4% |
| Median | 14.6% | 15.4% |
| Interquartile 25% (IQ1) | 13.0% | 14.2% |
| Interquartile 75% (IQ3) | 15.6% | 17.1% |
| Interquartile Range (IQR) | 2.6% | 3.0% |
| Standard Deviation (Sample) | 3.3% | 2.2% |
| Standard Deviation (Population) | 3.2% | 2.2% |
Similar Demographics by Cognitive Disability
Demographics Similar to Immigrants from Chile by Cognitive Disability
In terms of cognitive disability, the demographic groups most similar to Immigrants from Chile are Immigrants from Jordan (17.0%, a difference of 0.020%), Immigrants from Germany (17.0%, a difference of 0.040%), White/Caucasian (17.0%, a difference of 0.040%), Lebanese (17.0%, a difference of 0.040%), and Israeli (17.0%, a difference of 0.060%).
| Demographics | Rating | Rank | Cognitive Disability |
| Immigrants | Costa Rica | 93.1 /100 | #127 | Exceptional 17.0% |
| Nicaraguans | 93.0 /100 | #128 | Exceptional 17.0% |
| Immigrants | Uruguay | 92.9 /100 | #129 | Exceptional 17.0% |
| Immigrants | Vietnam | 92.4 /100 | #130 | Exceptional 17.0% |
| Immigrants | Germany | 92.1 /100 | #131 | Exceptional 17.0% |
| Whites/Caucasians | 92.1 /100 | #132 | Exceptional 17.0% |
| Immigrants | Jordan | 91.9 /100 | #133 | Exceptional 17.0% |
| Immigrants | Chile | 91.7 /100 | #134 | Exceptional 17.0% |
| Lebanese | 91.3 /100 | #135 | Exceptional 17.0% |
| Israelis | 91.0 /100 | #136 | Exceptional 17.0% |
| Immigrants | Norway | 90.9 /100 | #137 | Exceptional 17.0% |
| Welsh | 90.8 /100 | #138 | Exceptional 17.0% |
| French | 90.0 /100 | #139 | Excellent 17.0% |
| Chileans | 89.9 /100 | #140 | Excellent 17.0% |
| Aleuts | 89.9 /100 | #141 | Excellent 17.0% |
Demographics Similar to Asians by Cognitive Disability
In terms of cognitive disability, the demographic groups most similar to Asians are Immigrants from Southern Europe (16.7%, a difference of 0.040%), Immigrants from South America (16.7%, a difference of 0.050%), Danish (16.7%, a difference of 0.060%), English (16.8%, a difference of 0.060%), and Immigrants from Egypt (16.7%, a difference of 0.070%).
| Demographics | Rating | Rank | Cognitive Disability |
| Native Hawaiians | 99.0 /100 | #87 | Exceptional 16.7% |
| Immigrants | Philippines | 99.0 /100 | #88 | Exceptional 16.7% |
| Immigrants | Egypt | 98.8 /100 | #89 | Exceptional 16.7% |
| South Americans | 98.8 /100 | #90 | Exceptional 16.7% |
| Danes | 98.8 /100 | #91 | Exceptional 16.7% |
| Immigrants | South America | 98.8 /100 | #92 | Exceptional 16.7% |
| Immigrants | Southern Europe | 98.7 /100 | #93 | Exceptional 16.7% |
| Asians | 98.7 /100 | #94 | Exceptional 16.7% |
| English | 98.6 /100 | #95 | Exceptional 16.8% |
| Finns | 98.5 /100 | #96 | Exceptional 16.8% |
| Dutch | 98.5 /100 | #97 | Exceptional 16.8% |
| Immigrants | Lebanon | 98.4 /100 | #98 | Exceptional 16.8% |
| Jordanians | 98.2 /100 | #99 | Exceptional 16.8% |
| Immigrants | Russia | 98.2 /100 | #100 | Exceptional 16.8% |
| Immigrants | Asia | 98.1 /100 | #101 | Exceptional 16.8% |