Immigrants from Caribbean vs Canadian Disability Age 65 to 74
COMPARE
Immigrants from Caribbean
Canadian
Disability Age 65 to 74
Disability Age 65 to 74 Comparison
Immigrants from Caribbean
Canadians
24.6%
DISABILITY AGE 65 TO 74
2.6/ 100
METRIC RATING
239th/ 347
METRIC RANK
22.9%
DISABILITY AGE 65 TO 74
77.7/ 100
METRIC RATING
150th/ 347
METRIC RANK
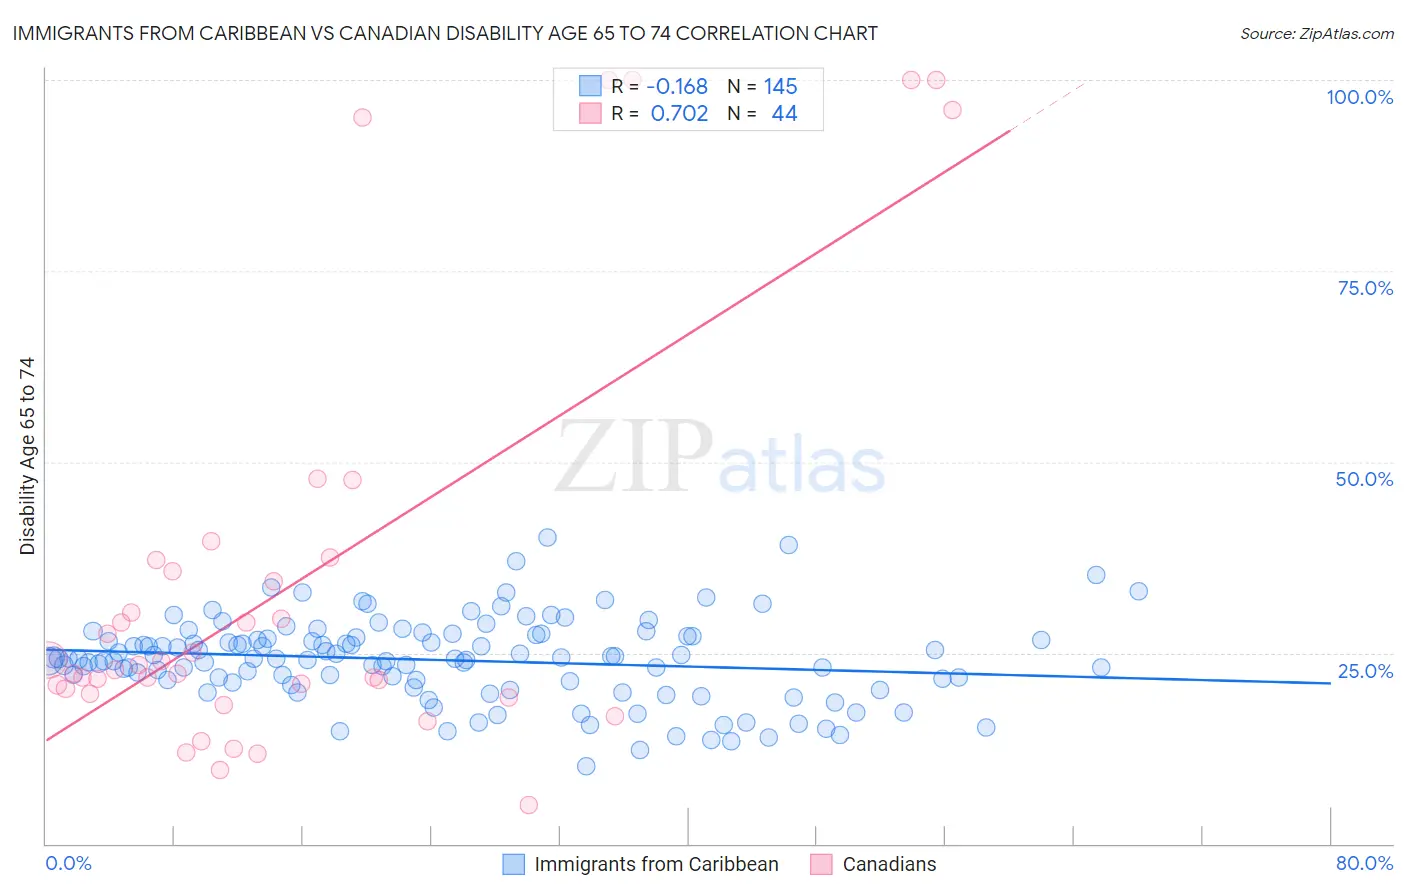
Immigrants from Caribbean vs Canadian Disability Age 65 to 74 Correlation Chart
The statistical analysis conducted on geographies consisting of 448,746,913 people shows a poor negative correlation between the proportion of Immigrants from Caribbean and percentage of population with a disability between the ages 65 and 75 in the United States with a correlation coefficient (R) of -0.168 and weighted average of 24.6%. Similarly, the statistical analysis conducted on geographies consisting of 436,683,818 people shows a strong positive correlation between the proportion of Canadians and percentage of population with a disability between the ages 65 and 75 in the United States with a correlation coefficient (R) of 0.702 and weighted average of 22.9%, a difference of 7.2%.
Disability Age 65 to 74 Correlation Summary
| Measurement | Immigrants from Caribbean | Canadian |
| Minimum | 10.1% | 5.0% |
| Maximum | 40.1% | 100.0% |
| Range | 30.0% | 95.0% |
| Mean | 24.0% | 34.2% |
| Median | 24.2% | 23.0% |
| Interquartile 25% (IQ1) | 21.2% | 20.0% |
| Interquartile 75% (IQ3) | 27.1% | 36.4% |
| Interquartile Range (IQR) | 5.9% | 16.5% |
| Standard Deviation (Sample) | 5.4% | 27.4% |
| Standard Deviation (Population) | 5.4% | 27.1% |
Similar Demographics by Disability Age 65 to 74
Demographics Similar to Immigrants from Caribbean by Disability Age 65 to 74
In terms of disability age 65 to 74, the demographic groups most similar to Immigrants from Caribbean are Spaniard (24.6%, a difference of 0.090%), Immigrants from Western Africa (24.6%, a difference of 0.17%), Immigrants from Ghana (24.5%, a difference of 0.22%), Immigrants from Senegal (24.6%, a difference of 0.25%), and Spanish (24.6%, a difference of 0.26%).
| Demographics | Rating | Rank | Disability Age 65 to 74 |
| Immigrants | Zaire | 5.0 /100 | #232 | Tragic 24.3% |
| Bahamians | 4.5 /100 | #233 | Tragic 24.4% |
| Panamanians | 4.2 /100 | #234 | Tragic 24.4% |
| Scotch-Irish | 3.8 /100 | #235 | Tragic 24.4% |
| German Russians | 3.7 /100 | #236 | Tragic 24.4% |
| West Indians | 3.4 /100 | #237 | Tragic 24.5% |
| Immigrants | Ghana | 3.0 /100 | #238 | Tragic 24.5% |
| Immigrants | Caribbean | 2.6 /100 | #239 | Tragic 24.6% |
| Spaniards | 2.4 /100 | #240 | Tragic 24.6% |
| Immigrants | Western Africa | 2.3 /100 | #241 | Tragic 24.6% |
| Immigrants | Senegal | 2.2 /100 | #242 | Tragic 24.6% |
| Spanish | 2.2 /100 | #243 | Tragic 24.6% |
| Armenians | 2.0 /100 | #244 | Tragic 24.7% |
| British West Indians | 2.0 /100 | #245 | Tragic 24.7% |
| Immigrants | Iraq | 1.9 /100 | #246 | Tragic 24.7% |
Demographics Similar to Canadians by Disability Age 65 to 74
In terms of disability age 65 to 74, the demographic groups most similar to Canadians are Immigrants from Morocco (22.9%, a difference of 0.0%), Finnish (22.9%, a difference of 0.090%), Swiss (22.9%, a difference of 0.18%), New Zealander (22.9%, a difference of 0.20%), and Slavic (23.0%, a difference of 0.20%).
| Demographics | Rating | Rank | Disability Age 65 to 74 |
| Arabs | 84.8 /100 | #143 | Excellent 22.8% |
| Danes | 84.4 /100 | #144 | Excellent 22.8% |
| Immigrants | Uganda | 84.0 /100 | #145 | Excellent 22.8% |
| Alsatians | 83.7 /100 | #146 | Excellent 22.8% |
| Immigrants | Uzbekistan | 83.1 /100 | #147 | Excellent 22.8% |
| New Zealanders | 79.9 /100 | #148 | Good 22.9% |
| Swiss | 79.7 /100 | #149 | Good 22.9% |
| Canadians | 77.7 /100 | #150 | Good 22.9% |
| Immigrants | Morocco | 77.6 /100 | #151 | Good 22.9% |
| Finns | 76.5 /100 | #152 | Good 22.9% |
| Slavs | 75.2 /100 | #153 | Good 23.0% |
| Sri Lankans | 74.0 /100 | #154 | Good 23.0% |
| British | 73.9 /100 | #155 | Good 23.0% |
| Immigrants | Western Asia | 73.8 /100 | #156 | Good 23.0% |
| Czechoslovakians | 72.4 /100 | #157 | Good 23.0% |