Immigrants from Caribbean vs Alaska Native Disability Age 65 to 74
COMPARE
Immigrants from Caribbean
Alaska Native
Disability Age 65 to 74
Disability Age 65 to 74 Comparison
Immigrants from Caribbean
Alaska Natives
24.6%
DISABILITY AGE 65 TO 74
2.6/ 100
METRIC RATING
239th/ 347
METRIC RANK
30.6%
DISABILITY AGE 65 TO 74
0.0/ 100
METRIC RATING
334th/ 347
METRIC RANK
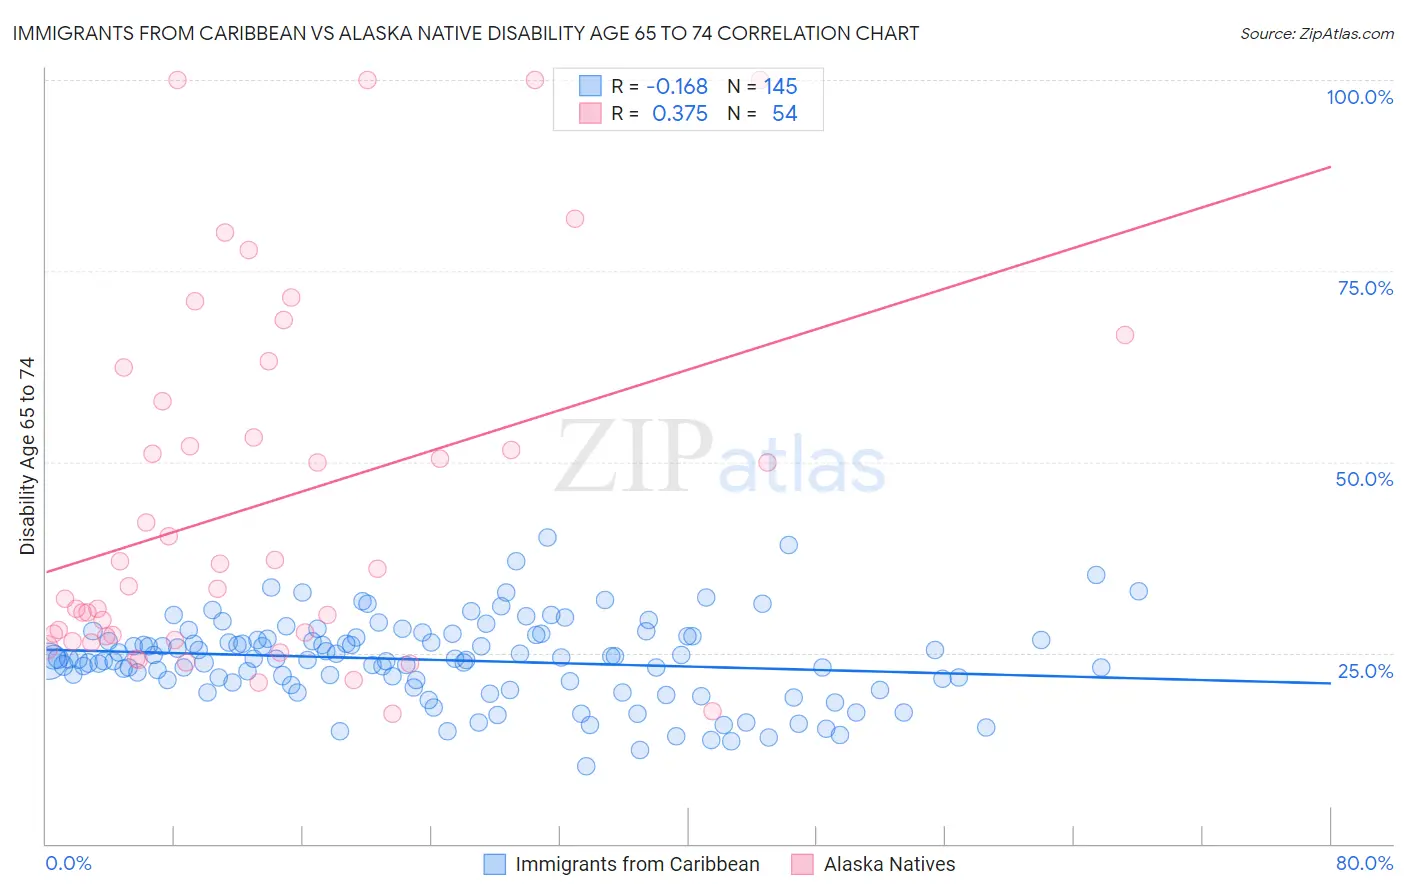
Immigrants from Caribbean vs Alaska Native Disability Age 65 to 74 Correlation Chart
The statistical analysis conducted on geographies consisting of 448,746,913 people shows a poor negative correlation between the proportion of Immigrants from Caribbean and percentage of population with a disability between the ages 65 and 75 in the United States with a correlation coefficient (R) of -0.168 and weighted average of 24.6%. Similarly, the statistical analysis conducted on geographies consisting of 76,681,406 people shows a mild positive correlation between the proportion of Alaska Natives and percentage of population with a disability between the ages 65 and 75 in the United States with a correlation coefficient (R) of 0.375 and weighted average of 30.6%, a difference of 24.6%.
Disability Age 65 to 74 Correlation Summary
| Measurement | Immigrants from Caribbean | Alaska Native |
| Minimum | 10.1% | 16.9% |
| Maximum | 40.1% | 100.0% |
| Range | 30.0% | 83.1% |
| Mean | 24.0% | 44.6% |
| Median | 24.2% | 34.9% |
| Interquartile 25% (IQ1) | 21.2% | 27.2% |
| Interquartile 75% (IQ3) | 27.1% | 58.0% |
| Interquartile Range (IQR) | 5.9% | 30.8% |
| Standard Deviation (Sample) | 5.4% | 23.4% |
| Standard Deviation (Population) | 5.4% | 23.2% |
Similar Demographics by Disability Age 65 to 74
Demographics Similar to Immigrants from Caribbean by Disability Age 65 to 74
In terms of disability age 65 to 74, the demographic groups most similar to Immigrants from Caribbean are Spaniard (24.6%, a difference of 0.090%), Immigrants from Western Africa (24.6%, a difference of 0.17%), Immigrants from Ghana (24.5%, a difference of 0.22%), Immigrants from Senegal (24.6%, a difference of 0.25%), and Spanish (24.6%, a difference of 0.26%).
| Demographics | Rating | Rank | Disability Age 65 to 74 |
| Immigrants | Zaire | 5.0 /100 | #232 | Tragic 24.3% |
| Bahamians | 4.5 /100 | #233 | Tragic 24.4% |
| Panamanians | 4.2 /100 | #234 | Tragic 24.4% |
| Scotch-Irish | 3.8 /100 | #235 | Tragic 24.4% |
| German Russians | 3.7 /100 | #236 | Tragic 24.4% |
| West Indians | 3.4 /100 | #237 | Tragic 24.5% |
| Immigrants | Ghana | 3.0 /100 | #238 | Tragic 24.5% |
| Immigrants | Caribbean | 2.6 /100 | #239 | Tragic 24.6% |
| Spaniards | 2.4 /100 | #240 | Tragic 24.6% |
| Immigrants | Western Africa | 2.3 /100 | #241 | Tragic 24.6% |
| Immigrants | Senegal | 2.2 /100 | #242 | Tragic 24.6% |
| Spanish | 2.2 /100 | #243 | Tragic 24.6% |
| Armenians | 2.0 /100 | #244 | Tragic 24.7% |
| British West Indians | 2.0 /100 | #245 | Tragic 24.7% |
| Immigrants | Iraq | 1.9 /100 | #246 | Tragic 24.7% |
Demographics Similar to Alaska Natives by Disability Age 65 to 74
In terms of disability age 65 to 74, the demographic groups most similar to Alaska Natives are Colville (30.5%, a difference of 0.25%), Native/Alaskan (30.4%, a difference of 0.77%), Chickasaw (30.2%, a difference of 1.4%), Creek (30.2%, a difference of 1.4%), and Choctaw (30.2%, a difference of 1.4%).
| Demographics | Rating | Rank | Disability Age 65 to 74 |
| Apache | 0.0 /100 | #327 | Tragic 29.7% |
| Hopi | 0.0 /100 | #328 | Tragic 30.0% |
| Choctaw | 0.0 /100 | #329 | Tragic 30.2% |
| Creek | 0.0 /100 | #330 | Tragic 30.2% |
| Chickasaw | 0.0 /100 | #331 | Tragic 30.2% |
| Natives/Alaskans | 0.0 /100 | #332 | Tragic 30.4% |
| Colville | 0.0 /100 | #333 | Tragic 30.5% |
| Alaska Natives | 0.0 /100 | #334 | Tragic 30.6% |
| Cheyenne | 0.0 /100 | #335 | Tragic 31.1% |
| Yuman | 0.0 /100 | #336 | Tragic 31.5% |
| Houma | 0.0 /100 | #337 | Tragic 32.3% |
| Alaskan Athabascans | 0.0 /100 | #338 | Tragic 32.4% |
| Kiowa | 0.0 /100 | #339 | Tragic 32.6% |
| Lumbee | 0.0 /100 | #340 | Tragic 32.7% |
| Tsimshian | 0.0 /100 | #341 | Tragic 32.9% |