Chippewa vs Canadian Disability Age 65 to 74
COMPARE
Chippewa
Canadian
Disability Age 65 to 74
Disability Age 65 to 74 Comparison
Chippewa
Canadians
27.8%
DISABILITY AGE 65 TO 74
0.0/ 100
METRIC RATING
314th/ 347
METRIC RANK
22.9%
DISABILITY AGE 65 TO 74
77.7/ 100
METRIC RATING
150th/ 347
METRIC RANK
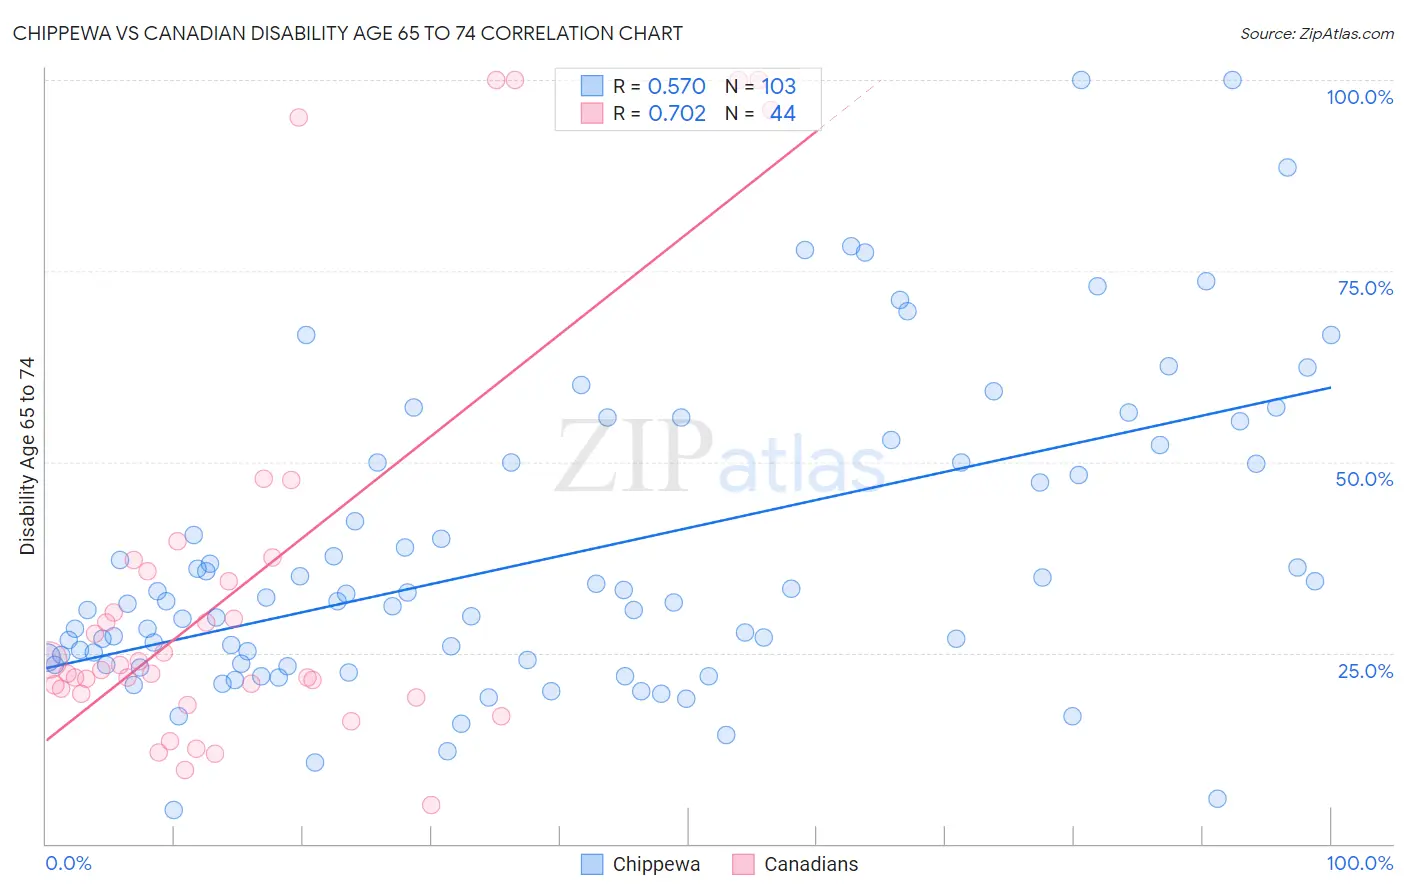
Chippewa vs Canadian Disability Age 65 to 74 Correlation Chart
The statistical analysis conducted on geographies consisting of 214,741,150 people shows a substantial positive correlation between the proportion of Chippewa and percentage of population with a disability between the ages 65 and 75 in the United States with a correlation coefficient (R) of 0.570 and weighted average of 27.8%. Similarly, the statistical analysis conducted on geographies consisting of 436,683,818 people shows a strong positive correlation between the proportion of Canadians and percentage of population with a disability between the ages 65 and 75 in the United States with a correlation coefficient (R) of 0.702 and weighted average of 22.9%, a difference of 21.3%.
Disability Age 65 to 74 Correlation Summary
| Measurement | Chippewa | Canadian |
| Minimum | 4.3% | 5.0% |
| Maximum | 100.0% | 100.0% |
| Range | 95.7% | 95.0% |
| Mean | 37.7% | 34.2% |
| Median | 31.7% | 23.0% |
| Interquartile 25% (IQ1) | 23.6% | 20.0% |
| Interquartile 75% (IQ3) | 50.0% | 36.4% |
| Interquartile Range (IQR) | 26.4% | 16.5% |
| Standard Deviation (Sample) | 19.8% | 27.4% |
| Standard Deviation (Population) | 19.8% | 27.1% |
Similar Demographics by Disability Age 65 to 74
Demographics Similar to Chippewa by Disability Age 65 to 74
In terms of disability age 65 to 74, the demographic groups most similar to Chippewa are Paiute (27.8%, a difference of 0.010%), Cajun (27.9%, a difference of 0.47%), Crow (27.9%, a difference of 0.52%), Immigrants from Armenia (28.0%, a difference of 0.60%), and Nepalese (28.0%, a difference of 0.83%).
| Demographics | Rating | Rank | Disability Age 65 to 74 |
| Ute | 0.0 /100 | #307 | Tragic 27.3% |
| Sioux | 0.0 /100 | #308 | Tragic 27.3% |
| Yaqui | 0.0 /100 | #309 | Tragic 27.4% |
| Shoshone | 0.0 /100 | #310 | Tragic 27.4% |
| Menominee | 0.0 /100 | #311 | Tragic 27.4% |
| Osage | 0.0 /100 | #312 | Tragic 27.5% |
| Paiute | 0.0 /100 | #313 | Tragic 27.8% |
| Chippewa | 0.0 /100 | #314 | Tragic 27.8% |
| Cajuns | 0.0 /100 | #315 | Tragic 27.9% |
| Crow | 0.0 /100 | #316 | Tragic 27.9% |
| Immigrants | Armenia | 0.0 /100 | #317 | Tragic 28.0% |
| Nepalese | 0.0 /100 | #318 | Tragic 28.0% |
| Arapaho | 0.0 /100 | #319 | Tragic 28.1% |
| Cherokee | 0.0 /100 | #320 | Tragic 28.2% |
| Comanche | 0.0 /100 | #321 | Tragic 28.3% |
Demographics Similar to Canadians by Disability Age 65 to 74
In terms of disability age 65 to 74, the demographic groups most similar to Canadians are Immigrants from Morocco (22.9%, a difference of 0.0%), Finnish (22.9%, a difference of 0.090%), Swiss (22.9%, a difference of 0.18%), New Zealander (22.9%, a difference of 0.20%), and Slavic (23.0%, a difference of 0.20%).
| Demographics | Rating | Rank | Disability Age 65 to 74 |
| Arabs | 84.8 /100 | #143 | Excellent 22.8% |
| Danes | 84.4 /100 | #144 | Excellent 22.8% |
| Immigrants | Uganda | 84.0 /100 | #145 | Excellent 22.8% |
| Alsatians | 83.7 /100 | #146 | Excellent 22.8% |
| Immigrants | Uzbekistan | 83.1 /100 | #147 | Excellent 22.8% |
| New Zealanders | 79.9 /100 | #148 | Good 22.9% |
| Swiss | 79.7 /100 | #149 | Good 22.9% |
| Canadians | 77.7 /100 | #150 | Good 22.9% |
| Immigrants | Morocco | 77.6 /100 | #151 | Good 22.9% |
| Finns | 76.5 /100 | #152 | Good 22.9% |
| Slavs | 75.2 /100 | #153 | Good 23.0% |
| Sri Lankans | 74.0 /100 | #154 | Good 23.0% |
| British | 73.9 /100 | #155 | Good 23.0% |
| Immigrants | Western Asia | 73.8 /100 | #156 | Good 23.0% |
| Czechoslovakians | 72.4 /100 | #157 | Good 23.0% |