Immigrants from Caribbean vs Nicaraguan Female Disability
COMPARE
Immigrants from Caribbean
Nicaraguan
Female Disability
Female Disability Comparison
Immigrants from Caribbean
Nicaraguans
12.7%
FEMALE DISABILITY
1.4/ 100
METRIC RATING
252nd/ 347
METRIC RANK
11.9%
FEMALE DISABILITY
95.2/ 100
METRIC RATING
130th/ 347
METRIC RANK
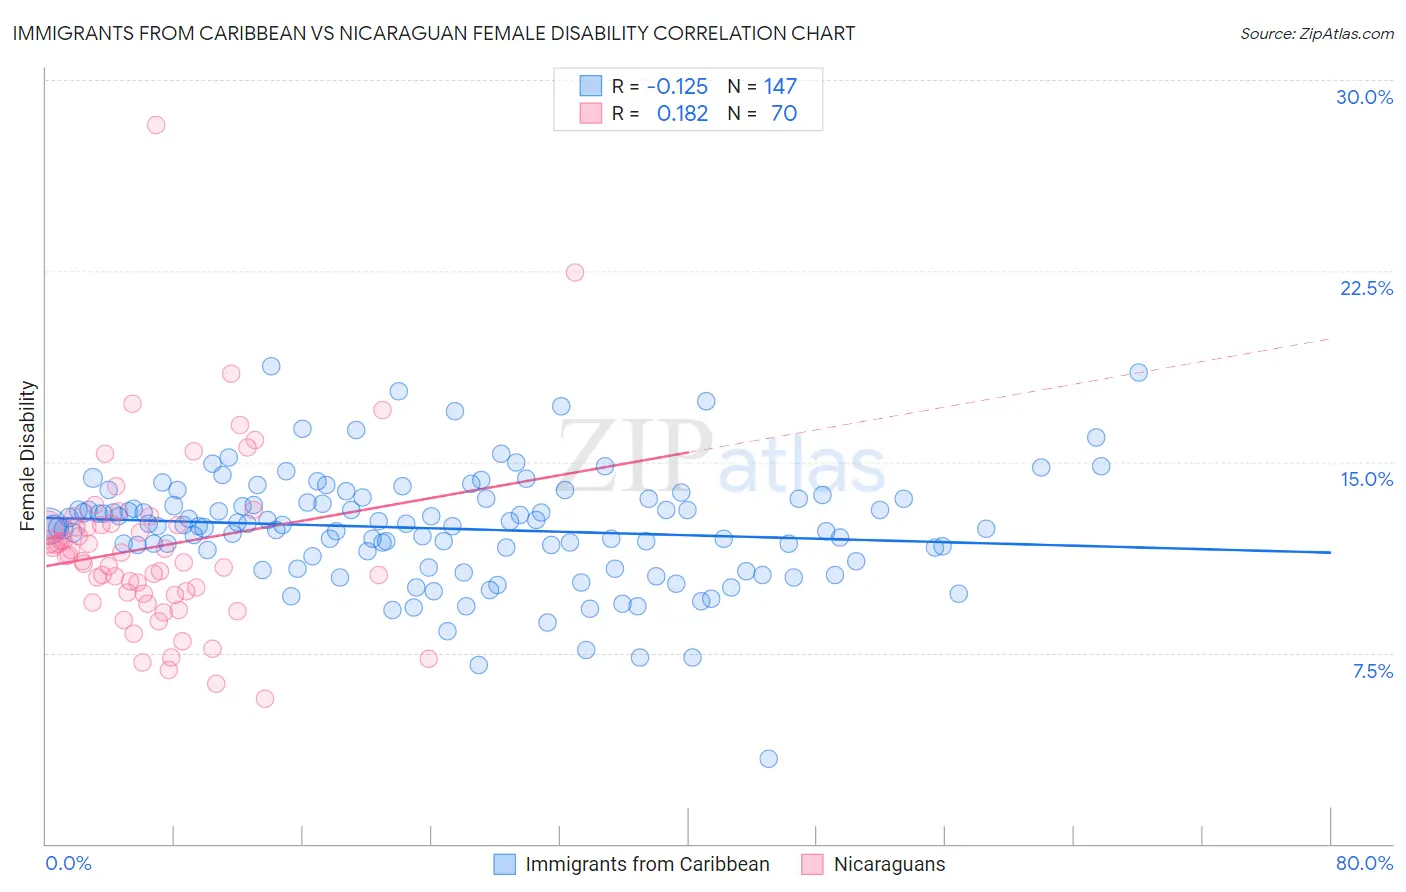
Immigrants from Caribbean vs Nicaraguan Female Disability Correlation Chart
The statistical analysis conducted on geographies consisting of 449,918,897 people shows a poor negative correlation between the proportion of Immigrants from Caribbean and percentage of females with a disability in the United States with a correlation coefficient (R) of -0.125 and weighted average of 12.7%. Similarly, the statistical analysis conducted on geographies consisting of 285,687,392 people shows a poor positive correlation between the proportion of Nicaraguans and percentage of females with a disability in the United States with a correlation coefficient (R) of 0.182 and weighted average of 11.9%, a difference of 7.0%.
Female Disability Correlation Summary
| Measurement | Immigrants from Caribbean | Nicaraguan |
| Minimum | 3.3% | 5.7% |
| Maximum | 18.7% | 28.3% |
| Range | 15.4% | 22.6% |
| Mean | 12.4% | 11.7% |
| Median | 12.5% | 11.3% |
| Interquartile 25% (IQ1) | 11.3% | 9.8% |
| Interquartile 75% (IQ3) | 13.5% | 12.5% |
| Interquartile Range (IQR) | 2.3% | 2.7% |
| Standard Deviation (Sample) | 2.2% | 3.5% |
| Standard Deviation (Population) | 2.2% | 3.5% |
Similar Demographics by Female Disability
Demographics Similar to Immigrants from Caribbean by Female Disability
In terms of female disability, the demographic groups most similar to Immigrants from Caribbean are Jamaican (12.7%, a difference of 0.010%), Hawaiian (12.7%, a difference of 0.040%), Crow (12.7%, a difference of 0.080%), Immigrants from Germany (12.7%, a difference of 0.12%), and Slovene (12.7%, a difference of 0.14%).
| Demographics | Rating | Rank | Female Disability |
| Immigrants | Jamaica | 2.2 /100 | #245 | Tragic 12.6% |
| Spanish American Indians | 2.1 /100 | #246 | Tragic 12.6% |
| Menominee | 2.1 /100 | #247 | Tragic 12.6% |
| Carpatho Rusyns | 2.0 /100 | #248 | Tragic 12.6% |
| Immigrants | Congo | 1.8 /100 | #249 | Tragic 12.7% |
| Slovenes | 1.7 /100 | #250 | Tragic 12.7% |
| Crow | 1.6 /100 | #251 | Tragic 12.7% |
| Immigrants | Caribbean | 1.4 /100 | #252 | Tragic 12.7% |
| Jamaicans | 1.4 /100 | #253 | Tragic 12.7% |
| Hawaiians | 1.4 /100 | #254 | Tragic 12.7% |
| Immigrants | Germany | 1.3 /100 | #255 | Tragic 12.7% |
| British West Indians | 1.2 /100 | #256 | Tragic 12.7% |
| Liberians | 1.1 /100 | #257 | Tragic 12.7% |
| Aleuts | 1.1 /100 | #258 | Tragic 12.7% |
| Immigrants | Armenia | 1.0 /100 | #259 | Tragic 12.7% |
Demographics Similar to Nicaraguans by Female Disability
In terms of female disability, the demographic groups most similar to Nicaraguans are Arab (11.9%, a difference of 0.030%), Macedonian (11.8%, a difference of 0.060%), Immigrants from Latvia (11.8%, a difference of 0.090%), Immigrants from Syria (11.9%, a difference of 0.12%), and South American Indian (11.8%, a difference of 0.13%).
| Demographics | Rating | Rank | Female Disability |
| Immigrants | Croatia | 96.7 /100 | #123 | Exceptional 11.8% |
| Russians | 96.5 /100 | #124 | Exceptional 11.8% |
| Immigrants | Italy | 96.4 /100 | #125 | Exceptional 11.8% |
| Immigrants | Europe | 96.2 /100 | #126 | Exceptional 11.8% |
| South American Indians | 95.8 /100 | #127 | Exceptional 11.8% |
| Immigrants | Latvia | 95.6 /100 | #128 | Exceptional 11.8% |
| Macedonians | 95.5 /100 | #129 | Exceptional 11.8% |
| Nicaraguans | 95.2 /100 | #130 | Exceptional 11.9% |
| Arabs | 95.1 /100 | #131 | Exceptional 11.9% |
| Immigrants | Syria | 94.6 /100 | #132 | Exceptional 11.9% |
| Kenyans | 94.5 /100 | #133 | Exceptional 11.9% |
| Immigrants | Nicaragua | 94.5 /100 | #134 | Exceptional 11.9% |
| Central Americans | 94.2 /100 | #135 | Exceptional 11.9% |
| Ugandans | 94.0 /100 | #136 | Exceptional 11.9% |
| Immigrants | Norway | 93.8 /100 | #137 | Exceptional 11.9% |