Potawatomi vs Alaska Native Disability Age 65 to 74
COMPARE
Potawatomi
Alaska Native
Disability Age 65 to 74
Disability Age 65 to 74 Comparison
Potawatomi
Alaska Natives
27.0%
DISABILITY AGE 65 TO 74
0.0/ 100
METRIC RATING
299th/ 347
METRIC RANK
30.6%
DISABILITY AGE 65 TO 74
0.0/ 100
METRIC RATING
334th/ 347
METRIC RANK
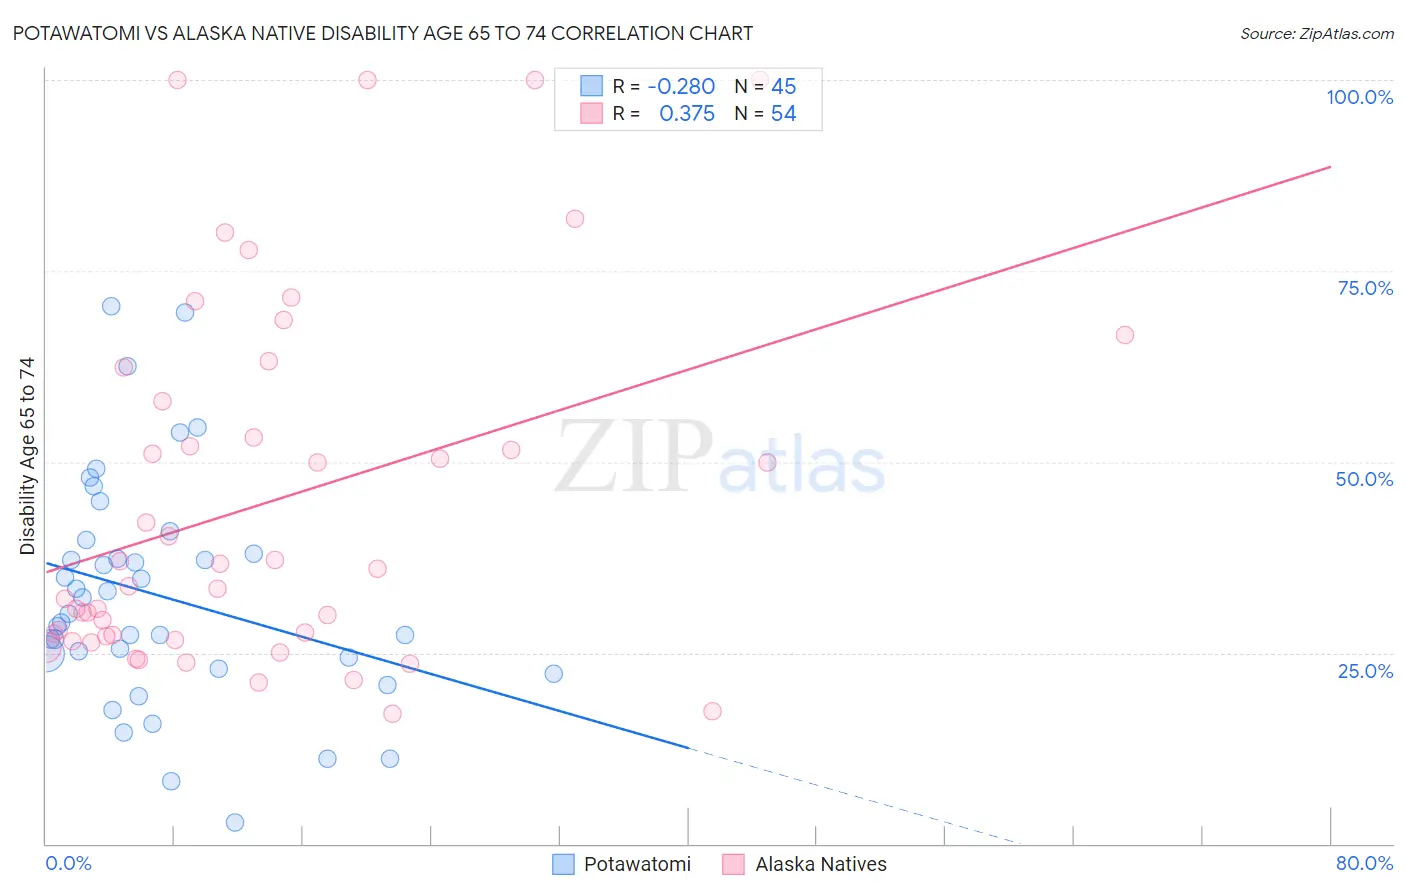
Potawatomi vs Alaska Native Disability Age 65 to 74 Correlation Chart
The statistical analysis conducted on geographies consisting of 117,710,706 people shows a weak negative correlation between the proportion of Potawatomi and percentage of population with a disability between the ages 65 and 75 in the United States with a correlation coefficient (R) of -0.280 and weighted average of 27.0%. Similarly, the statistical analysis conducted on geographies consisting of 76,681,406 people shows a mild positive correlation between the proportion of Alaska Natives and percentage of population with a disability between the ages 65 and 75 in the United States with a correlation coefficient (R) of 0.375 and weighted average of 30.6%, a difference of 13.4%.
Disability Age 65 to 74 Correlation Summary
| Measurement | Potawatomi | Alaska Native |
| Minimum | 2.7% | 16.9% |
| Maximum | 70.4% | 100.0% |
| Range | 67.7% | 83.1% |
| Mean | 32.5% | 44.6% |
| Median | 30.1% | 34.9% |
| Interquartile 25% (IQ1) | 23.6% | 27.2% |
| Interquartile 75% (IQ3) | 38.9% | 58.0% |
| Interquartile Range (IQR) | 15.2% | 30.8% |
| Standard Deviation (Sample) | 15.0% | 23.4% |
| Standard Deviation (Population) | 14.9% | 23.2% |
Similar Demographics by Disability Age 65 to 74
Demographics Similar to Potawatomi by Disability Age 65 to 74
In terms of disability age 65 to 74, the demographic groups most similar to Potawatomi are Immigrants from Yemen (27.0%, a difference of 0.030%), Immigrants from Dominican Republic (27.0%, a difference of 0.030%), Fijian (27.0%, a difference of 0.050%), Immigrants from Mexico (27.1%, a difference of 0.35%), and Central American Indian (27.1%, a difference of 0.36%).
| Demographics | Rating | Rank | Disability Age 65 to 74 |
| Blackfeet | 0.0 /100 | #292 | Tragic 26.6% |
| Immigrants | Central America | 0.0 /100 | #293 | Tragic 26.6% |
| Dominicans | 0.0 /100 | #294 | Tragic 26.7% |
| Hispanics or Latinos | 0.0 /100 | #295 | Tragic 26.7% |
| Bangladeshis | 0.0 /100 | #296 | Tragic 26.8% |
| Fijians | 0.0 /100 | #297 | Tragic 27.0% |
| Immigrants | Yemen | 0.0 /100 | #298 | Tragic 27.0% |
| Potawatomi | 0.0 /100 | #299 | Tragic 27.0% |
| Immigrants | Dominican Republic | 0.0 /100 | #300 | Tragic 27.0% |
| Immigrants | Mexico | 0.0 /100 | #301 | Tragic 27.1% |
| Central American Indians | 0.0 /100 | #302 | Tragic 27.1% |
| Tlingit-Haida | 0.0 /100 | #303 | Tragic 27.1% |
| Puget Sound Salish | 0.0 /100 | #304 | Tragic 27.2% |
| Mexicans | 0.0 /100 | #305 | Tragic 27.2% |
| Blacks/African Americans | 0.0 /100 | #306 | Tragic 27.3% |
Demographics Similar to Alaska Natives by Disability Age 65 to 74
In terms of disability age 65 to 74, the demographic groups most similar to Alaska Natives are Colville (30.5%, a difference of 0.25%), Native/Alaskan (30.4%, a difference of 0.77%), Chickasaw (30.2%, a difference of 1.4%), Creek (30.2%, a difference of 1.4%), and Choctaw (30.2%, a difference of 1.4%).
| Demographics | Rating | Rank | Disability Age 65 to 74 |
| Apache | 0.0 /100 | #327 | Tragic 29.7% |
| Hopi | 0.0 /100 | #328 | Tragic 30.0% |
| Choctaw | 0.0 /100 | #329 | Tragic 30.2% |
| Creek | 0.0 /100 | #330 | Tragic 30.2% |
| Chickasaw | 0.0 /100 | #331 | Tragic 30.2% |
| Natives/Alaskans | 0.0 /100 | #332 | Tragic 30.4% |
| Colville | 0.0 /100 | #333 | Tragic 30.5% |
| Alaska Natives | 0.0 /100 | #334 | Tragic 30.6% |
| Cheyenne | 0.0 /100 | #335 | Tragic 31.1% |
| Yuman | 0.0 /100 | #336 | Tragic 31.5% |
| Houma | 0.0 /100 | #337 | Tragic 32.3% |
| Alaskan Athabascans | 0.0 /100 | #338 | Tragic 32.4% |
| Kiowa | 0.0 /100 | #339 | Tragic 32.6% |
| Lumbee | 0.0 /100 | #340 | Tragic 32.7% |
| Tsimshian | 0.0 /100 | #341 | Tragic 32.9% |