Immigrants from Canada vs Pima Female Disability
COMPARE
Immigrants from Canada
Pima
Female Disability
Female Disability Comparison
Immigrants from Canada
Pima
12.3%
FEMALE DISABILITY
37.2/ 100
METRIC RATING
181st/ 347
METRIC RANK
14.8%
FEMALE DISABILITY
0.0/ 100
METRIC RATING
332nd/ 347
METRIC RANK
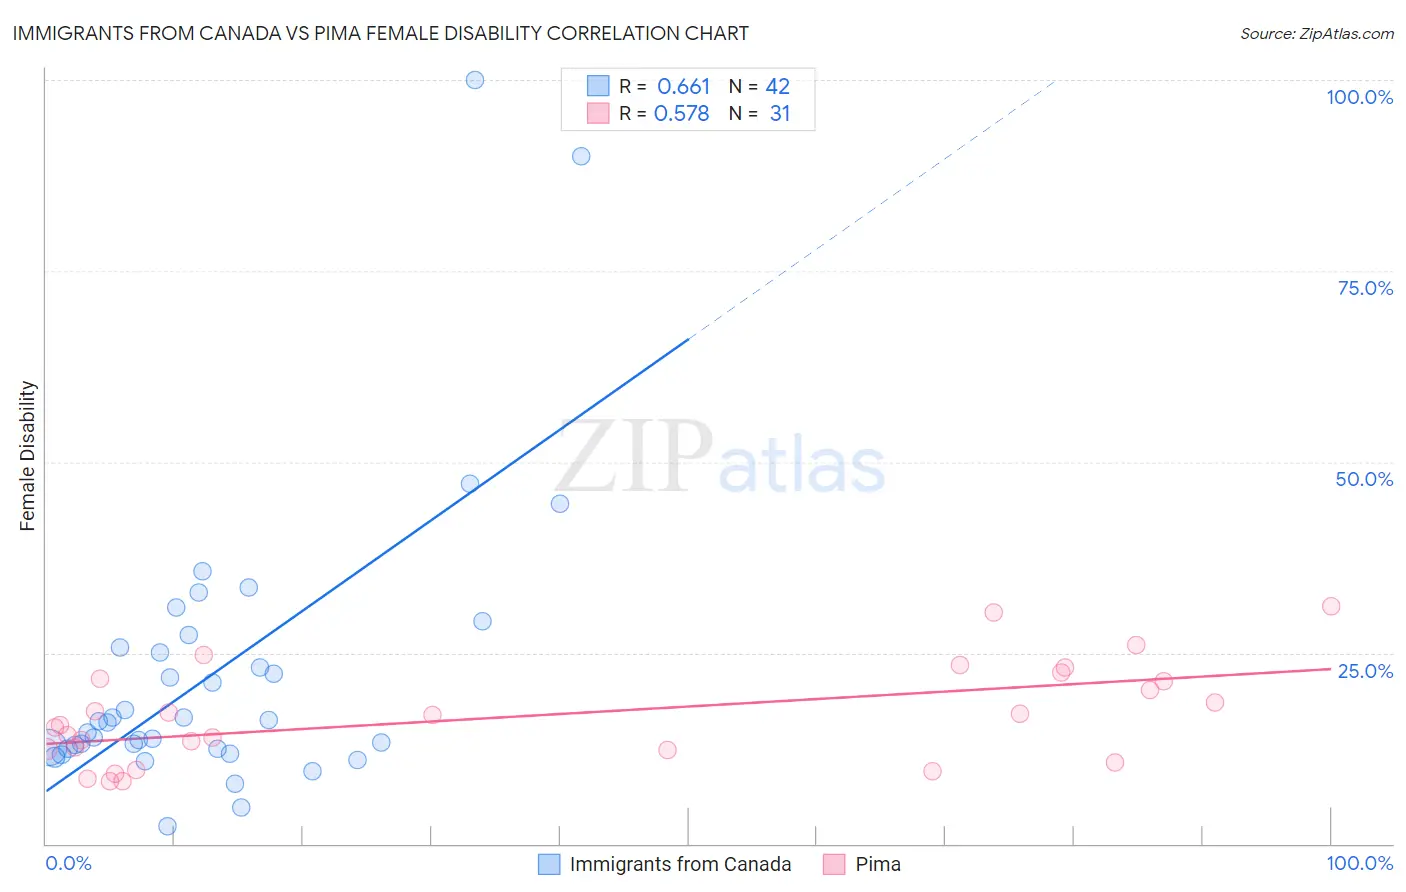
Immigrants from Canada vs Pima Female Disability Correlation Chart
The statistical analysis conducted on geographies consisting of 459,343,053 people shows a significant positive correlation between the proportion of Immigrants from Canada and percentage of females with a disability in the United States with a correlation coefficient (R) of 0.661 and weighted average of 12.3%. Similarly, the statistical analysis conducted on geographies consisting of 61,537,754 people shows a substantial positive correlation between the proportion of Pima and percentage of females with a disability in the United States with a correlation coefficient (R) of 0.578 and weighted average of 14.8%, a difference of 20.7%.
Female Disability Correlation Summary
| Measurement | Immigrants from Canada | Pima |
| Minimum | 2.3% | 8.1% |
| Maximum | 100.0% | 31.0% |
| Range | 97.7% | 22.9% |
| Mean | 22.3% | 16.7% |
| Median | 16.0% | 15.6% |
| Interquartile 25% (IQ1) | 12.5% | 12.3% |
| Interquartile 75% (IQ3) | 25.7% | 21.6% |
| Interquartile Range (IQR) | 13.2% | 9.3% |
| Standard Deviation (Sample) | 19.2% | 6.4% |
| Standard Deviation (Population) | 19.0% | 6.3% |
Similar Demographics by Female Disability
Demographics Similar to Immigrants from Canada by Female Disability
In terms of female disability, the demographic groups most similar to Immigrants from Canada are Norwegian (12.3%, a difference of 0.010%), Albanian (12.3%, a difference of 0.030%), Cuban (12.3%, a difference of 0.030%), Immigrants from Fiji (12.3%, a difference of 0.040%), and Iraqi (12.3%, a difference of 0.050%).
| Demographics | Rating | Rank | Female Disability |
| Immigrants | England | 50.0 /100 | #174 | Average 12.2% |
| Immigrants | St. Vincent and the Grenadines | 49.7 /100 | #175 | Average 12.2% |
| Immigrants | Guyana | 43.1 /100 | #176 | Average 12.2% |
| Immigrants | Ghana | 42.5 /100 | #177 | Average 12.2% |
| Immigrants | Western Europe | 40.9 /100 | #178 | Average 12.2% |
| Immigrants | Fiji | 38.2 /100 | #179 | Fair 12.3% |
| Albanians | 37.9 /100 | #180 | Fair 12.3% |
| Immigrants | Canada | 37.2 /100 | #181 | Fair 12.3% |
| Norwegians | 36.9 /100 | #182 | Fair 12.3% |
| Cubans | 36.5 /100 | #183 | Fair 12.3% |
| Iraqis | 36.0 /100 | #184 | Fair 12.3% |
| Immigrants | Uzbekistan | 33.9 /100 | #185 | Fair 12.3% |
| Austrians | 33.3 /100 | #186 | Fair 12.3% |
| Serbians | 33.1 /100 | #187 | Fair 12.3% |
| Immigrants | North America | 32.8 /100 | #188 | Fair 12.3% |
Demographics Similar to Pima by Female Disability
In terms of female disability, the demographic groups most similar to Pima are Immigrants from the Azores (14.9%, a difference of 0.39%), Cherokee (14.9%, a difference of 0.48%), Cajun (14.9%, a difference of 0.50%), Seminole (15.0%, a difference of 1.2%), and Tohono O'odham (15.0%, a difference of 1.3%).
| Demographics | Rating | Rank | Female Disability |
| Navajo | 0.0 /100 | #325 | Tragic 14.2% |
| Comanche | 0.0 /100 | #326 | Tragic 14.2% |
| Ottawa | 0.0 /100 | #327 | Tragic 14.2% |
| Cape Verdeans | 0.0 /100 | #328 | Tragic 14.2% |
| Osage | 0.0 /100 | #329 | Tragic 14.3% |
| Yuman | 0.0 /100 | #330 | Tragic 14.5% |
| Immigrants | Cabo Verde | 0.0 /100 | #331 | Tragic 14.6% |
| Pima | 0.0 /100 | #332 | Tragic 14.8% |
| Immigrants | Azores | 0.0 /100 | #333 | Tragic 14.9% |
| Cherokee | 0.0 /100 | #334 | Tragic 14.9% |
| Cajuns | 0.0 /100 | #335 | Tragic 14.9% |
| Seminole | 0.0 /100 | #336 | Tragic 15.0% |
| Tohono O'odham | 0.0 /100 | #337 | Tragic 15.0% |
| Dutch West Indians | 0.0 /100 | #338 | Tragic 15.0% |
| Colville | 0.0 /100 | #339 | Tragic 15.1% |