Immigrants from Singapore vs Pima Female Disability
COMPARE
Immigrants from Singapore
Pima
Female Disability
Female Disability Comparison
Immigrants from Singapore
Pima
10.4%
FEMALE DISABILITY
100.0/ 100
METRIC RATING
7th/ 347
METRIC RANK
14.8%
FEMALE DISABILITY
0.0/ 100
METRIC RATING
332nd/ 347
METRIC RANK
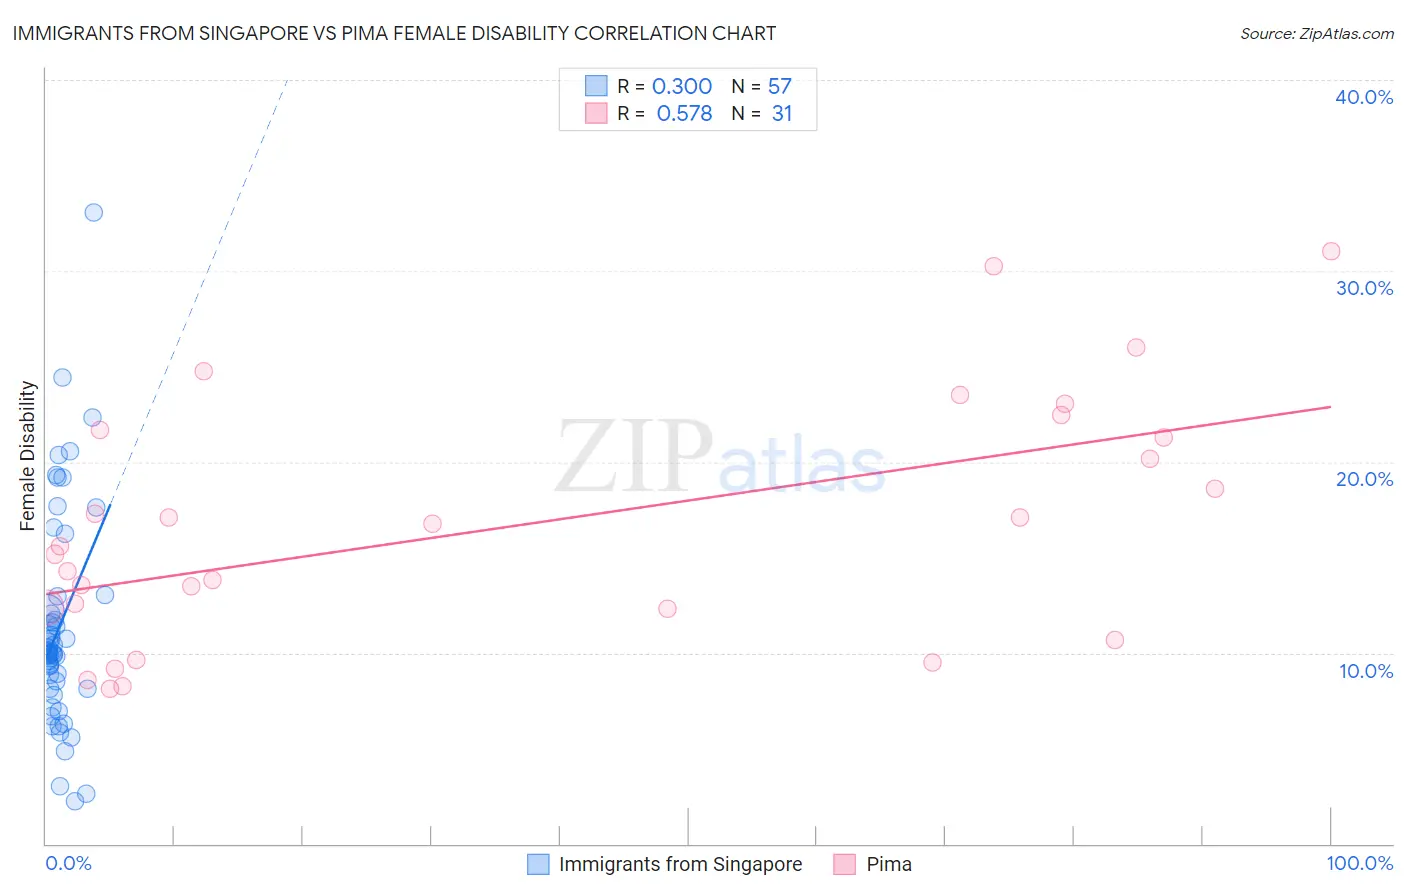
Immigrants from Singapore vs Pima Female Disability Correlation Chart
The statistical analysis conducted on geographies consisting of 137,521,534 people shows a weak positive correlation between the proportion of Immigrants from Singapore and percentage of females with a disability in the United States with a correlation coefficient (R) of 0.300 and weighted average of 10.4%. Similarly, the statistical analysis conducted on geographies consisting of 61,537,754 people shows a substantial positive correlation between the proportion of Pima and percentage of females with a disability in the United States with a correlation coefficient (R) of 0.578 and weighted average of 14.8%, a difference of 41.8%.
Female Disability Correlation Summary
| Measurement | Immigrants from Singapore | Pima |
| Minimum | 2.2% | 8.1% |
| Maximum | 33.0% | 31.0% |
| Range | 30.8% | 22.9% |
| Mean | 11.4% | 16.7% |
| Median | 10.0% | 15.6% |
| Interquartile 25% (IQ1) | 8.1% | 12.3% |
| Interquartile 75% (IQ3) | 12.6% | 21.6% |
| Interquartile Range (IQR) | 4.4% | 9.3% |
| Standard Deviation (Sample) | 5.7% | 6.4% |
| Standard Deviation (Population) | 5.6% | 6.3% |
Similar Demographics by Female Disability
Demographics Similar to Immigrants from Singapore by Female Disability
In terms of female disability, the demographic groups most similar to Immigrants from Singapore are Immigrants from South Central Asia (10.5%, a difference of 0.22%), Bolivian (10.4%, a difference of 0.78%), Iranian (10.6%, a difference of 1.1%), Immigrants from Bolivia (10.3%, a difference of 1.7%), and Immigrants from Hong Kong (10.6%, a difference of 1.8%).
| Demographics | Rating | Rank | Female Disability |
| Immigrants | India | 100.0 /100 | #1 | Exceptional 10.0% |
| Filipinos | 100.0 /100 | #2 | Exceptional 10.1% |
| Immigrants | Taiwan | 100.0 /100 | #3 | Exceptional 10.1% |
| Thais | 100.0 /100 | #4 | Exceptional 10.2% |
| Immigrants | Bolivia | 100.0 /100 | #5 | Exceptional 10.3% |
| Bolivians | 100.0 /100 | #6 | Exceptional 10.4% |
| Immigrants | Singapore | 100.0 /100 | #7 | Exceptional 10.4% |
| Immigrants | South Central Asia | 100.0 /100 | #8 | Exceptional 10.5% |
| Iranians | 100.0 /100 | #9 | Exceptional 10.6% |
| Immigrants | Hong Kong | 100.0 /100 | #10 | Exceptional 10.6% |
| Immigrants | Korea | 100.0 /100 | #11 | Exceptional 10.6% |
| Immigrants | Israel | 100.0 /100 | #12 | Exceptional 10.7% |
| Immigrants | Eastern Asia | 100.0 /100 | #13 | Exceptional 10.7% |
| Immigrants | China | 100.0 /100 | #14 | Exceptional 10.7% |
| Burmese | 100.0 /100 | #15 | Exceptional 10.7% |
Demographics Similar to Pima by Female Disability
In terms of female disability, the demographic groups most similar to Pima are Immigrants from the Azores (14.9%, a difference of 0.39%), Cherokee (14.9%, a difference of 0.48%), Cajun (14.9%, a difference of 0.50%), Seminole (15.0%, a difference of 1.2%), and Tohono O'odham (15.0%, a difference of 1.3%).
| Demographics | Rating | Rank | Female Disability |
| Navajo | 0.0 /100 | #325 | Tragic 14.2% |
| Comanche | 0.0 /100 | #326 | Tragic 14.2% |
| Ottawa | 0.0 /100 | #327 | Tragic 14.2% |
| Cape Verdeans | 0.0 /100 | #328 | Tragic 14.2% |
| Osage | 0.0 /100 | #329 | Tragic 14.3% |
| Yuman | 0.0 /100 | #330 | Tragic 14.5% |
| Immigrants | Cabo Verde | 0.0 /100 | #331 | Tragic 14.6% |
| Pima | 0.0 /100 | #332 | Tragic 14.8% |
| Immigrants | Azores | 0.0 /100 | #333 | Tragic 14.9% |
| Cherokee | 0.0 /100 | #334 | Tragic 14.9% |
| Cajuns | 0.0 /100 | #335 | Tragic 14.9% |
| Seminole | 0.0 /100 | #336 | Tragic 15.0% |
| Tohono O'odham | 0.0 /100 | #337 | Tragic 15.0% |
| Dutch West Indians | 0.0 /100 | #338 | Tragic 15.0% |
| Colville | 0.0 /100 | #339 | Tragic 15.1% |